CodeExecute PythonDebugging
Live debugging of Python scripts in Revit using VSCode's debugger.
RevitDevTool integrates debugpy to enable full VSCode debugging capabilities: set breakpoints, step through code, inspect variables, and debug Revit API calls in real-time.
flowchart TD
    subgraph VSCode["VSCode (Debugger)"]
        VS1[Set breakpoints in Python scripts]
        VS2[Press F5 to attach to Revit]
        VS3[Step through code execution]
        VS4[Inspect variables and Revit API objects]
    end

    subgraph Revit["Revit + RevitDevTool"]
        R1[Start debugpy listener on port 5678]
        R2[Wait for VSCode to attach]
        R3[Show connection status in UI]
        R4[Execute scripts with debugpy active]
        R5[Pause at breakpoints]
        R6[Send variable data to VSCode]

        R1 --> R2 --> R3 --> R4 --> R5 --> R6
    end

    VSCode <-->|debugpy protocol<br/>port 5678| Revit
Open RevitDevTool Settings and set the debug port (default: 5678):

Debug status indicator in Trace panel toolbar:
- 🔴 Red dot - Debugger not connected
- 🟢 Green dot - VSCode debugger attached and ready
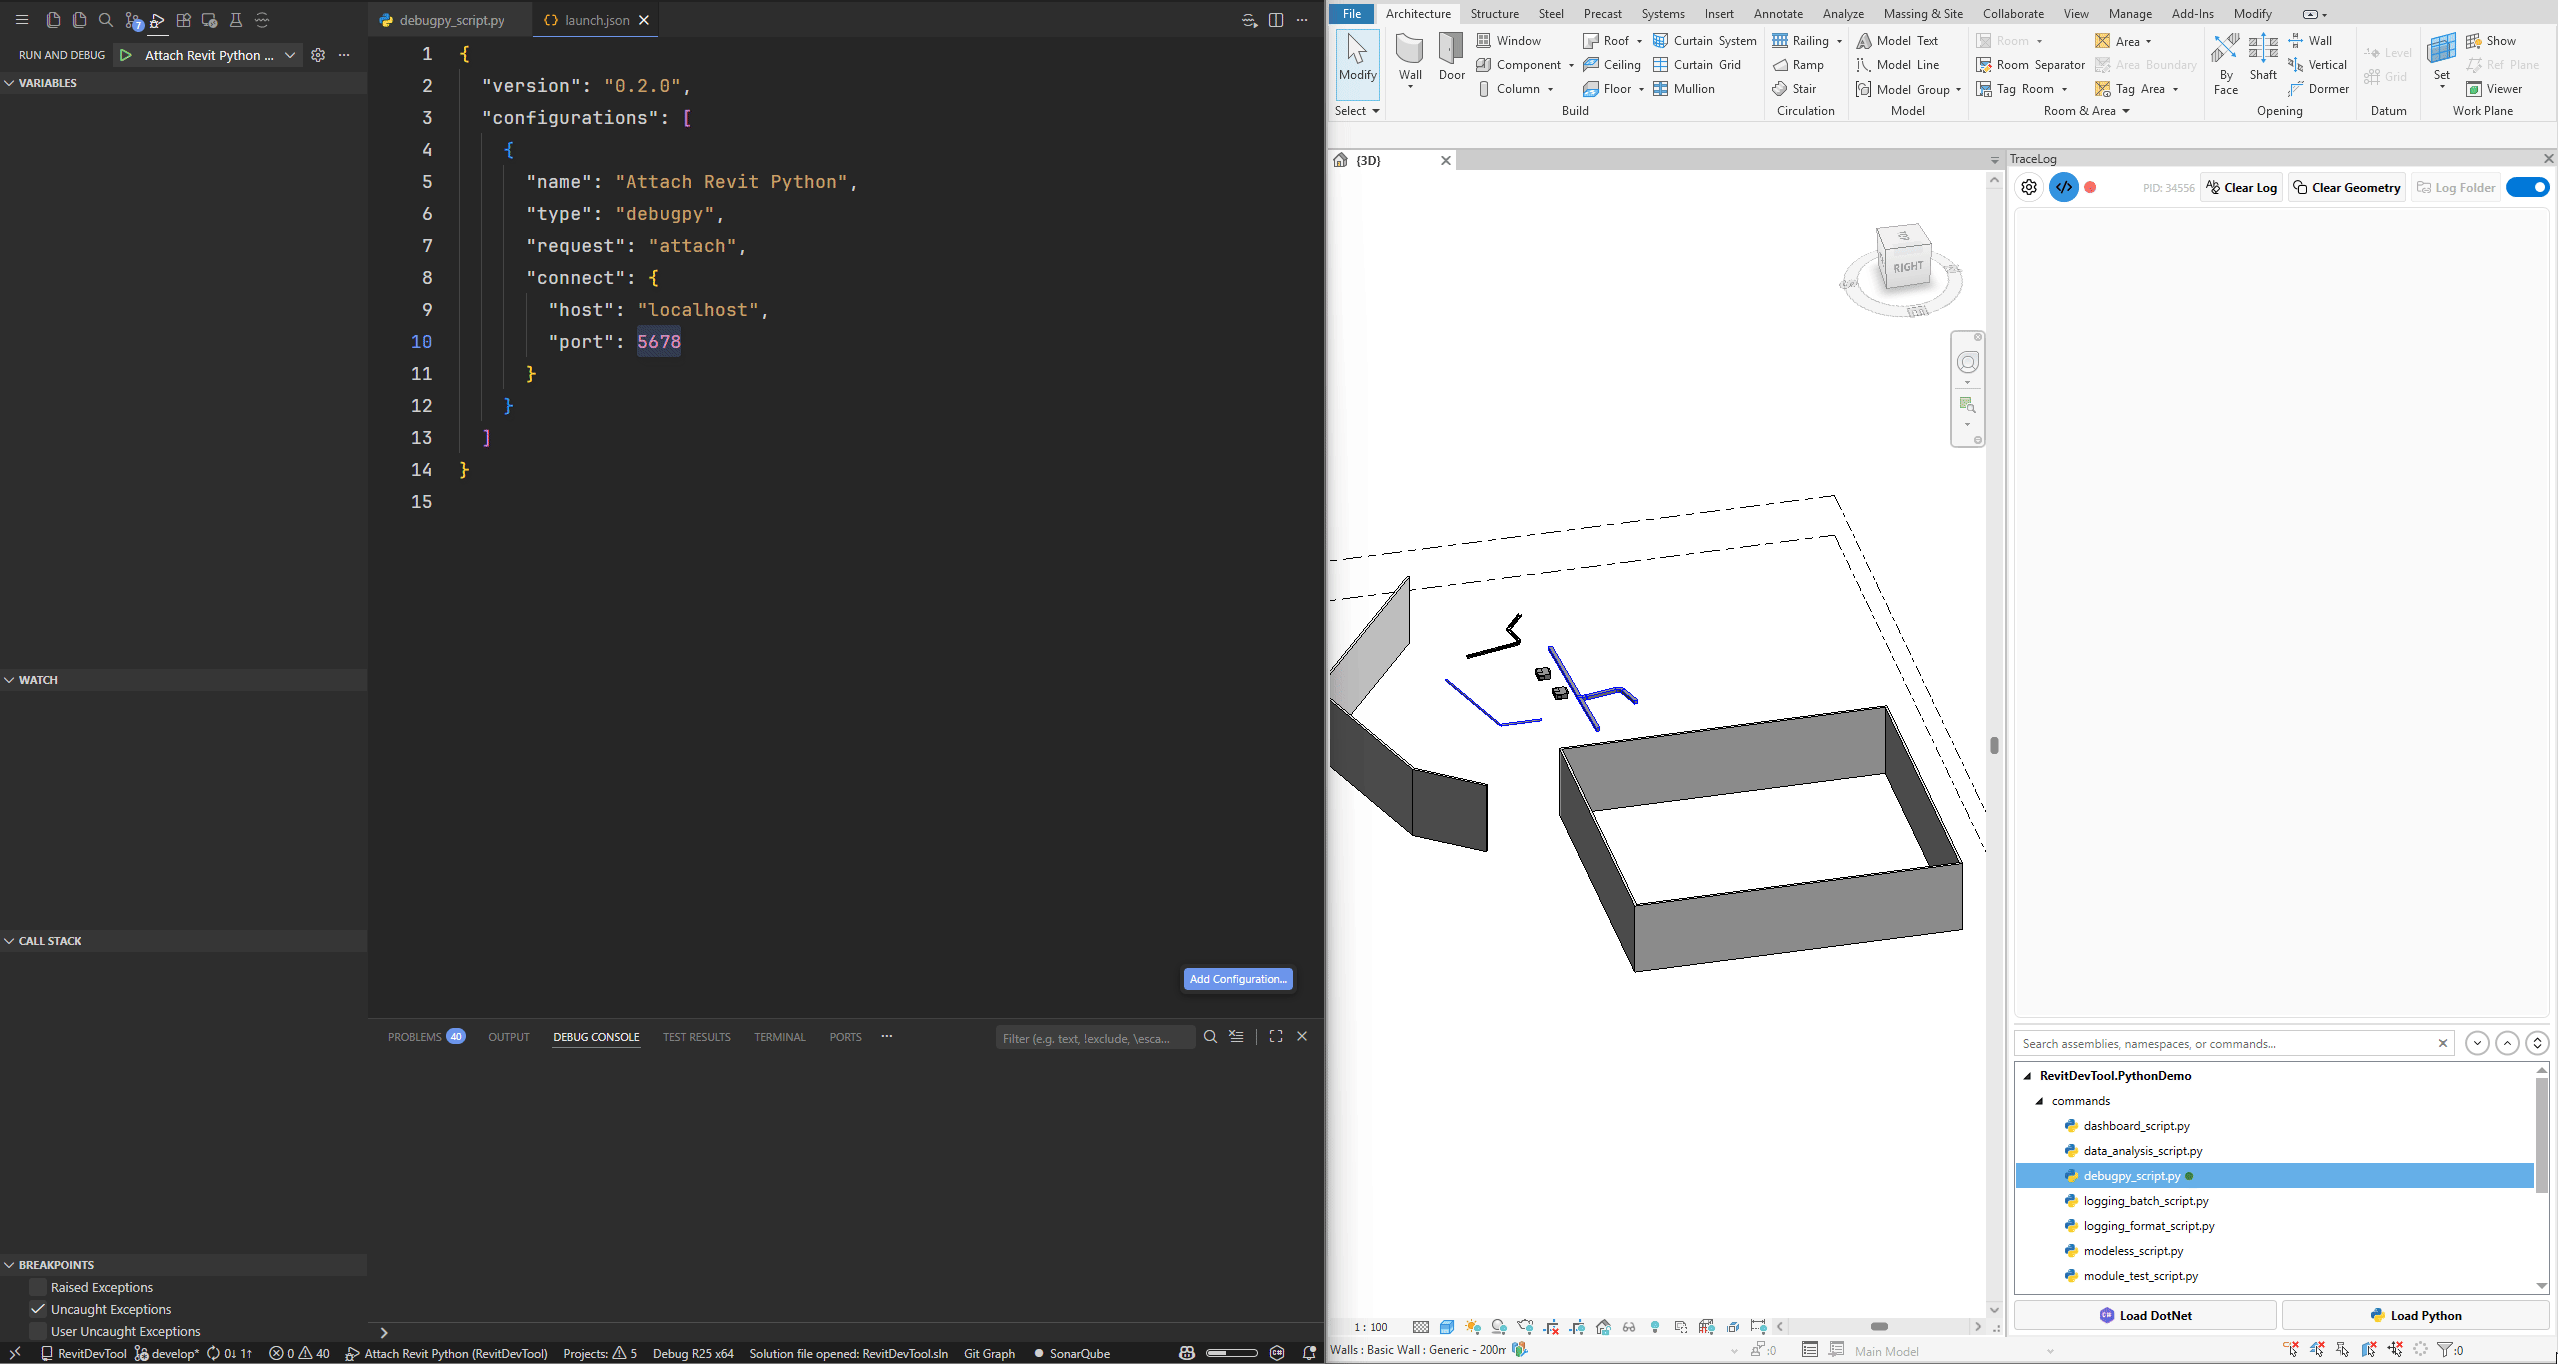
Add to .vscode/launch.json in your script folder:
{
  "version": "0.2.0",
  "configurations": [
    {
      "name": "Attach Revit Python",
      "type": "debugpy",
      "request": "attach",
      "connect": {
        "host": "localhost",
        "port": 5678
      }
    }
  ]
}
Configuration options:
-
port: 5678- Must match RevitDevTool debug port setting -
justMyCode: false- Allows debugging into Revit API and libraries -
pathMappings- Maps local files to execution paths
Step-by-step workflow:
- Launch Revit with RevitDevTool installed
- Open script folder in VSCode
- Set breakpoints (click left margin, red dot appears)
- Press F5 in VSCode (or Run → Start Debugging)
- Check status - Green dot 🟢 in Trace panel = connected
- Execute script in RevitDevTool
- Debugger pauses at your breakpoints
✅ Breakpoints
- Click line number margin to set/remove
- Red dot indicates active breakpoint
- Execution pauses when breakpoint is hit
✅ Step Controls
- Step Over (F10) - Execute current line, move to next
- Step Into (F11) - Enter function calls
- Step Out (Shift+F11) - Exit current function
- Continue (F5) - Resume until next breakpoint
✅ Variable Inspection
- Hover over variables to see values
- Variables panel shows all local/global variables
- Watch expressions - Add custom expressions to monitor
- Call stack - Navigate execution frames
✅ Debug Console
- Evaluate Python expressions during pause
- Access all variables in current scope
- Test Revit API calls interactively
✅ Conditional Breakpoints
- Right-click breakpoint → Edit Breakpoint
- Add condition:
wall.Id.IntegerValue > 1000 - Breaks only when condition is true
✅ Revit API Inspection
- Inspect
__revit__(UIApplication) - Examine
doc(Document) - Explore elements, parameters, geometry
- View collection contents
# /// script
# dependencies = ["numpy"]
# ///

import numpy as np
from Autodesk.Revit import DB

doc = __revit__.ActiveUIDocument.Document

# Set breakpoint here (line 10)
walls = DB.FilteredElementCollector(doc).OfClass(DB.Wall).ToElements()

areas = []
for wall in walls:
    # Set breakpoint here (line 15) to inspect each wall
    curve = wall.Location.Curve
    length = curve.Length

    # Conditional breakpoint: length > 10
    areas.append(length)
    print(f"Wall {wall.Id}: {length:.2f} ft")

# Set breakpoint here (line 23)
avg_length = np.mean(areas)
print(f"Average wall length: {avg_length:.2f} ft")1. Set breakpoints:
- Line 10: Before collecting walls
- Line 15: Inside loop to inspect each wall
- Line 23: After calculation
2. Execute script:
- Script runs until line 10
- Debugger pauses
3. Inspect variables:
- Hover over
doc→ See Document properties - Variables panel shows
__revit__,doc,np
4. Step through:
- Press F10 (Step Over) → Line 13
- Variables panel now shows
wallscollection - Expand
wallsto see elements
5. Continue to loop:
- Press F5 (Continue) → Pauses at line 15
- Inspect
wallvariable - Check
curve,lengthvalues - Debug Console: Type
wall.Nameto see wall name
6. Conditional breakpoint:
- Right-click line 15 → Edit Breakpoint
- Condition:
length > 10 - Press F5 → Only pauses for long walls
7. Complete execution:
- Press F5 to finish
- Check final output in Trace panel
from Autodesk.Revit import DB

doc = __revit__.ActiveUIDocument.Document

# Set breakpoint here
collector = DB.FilteredElementCollector(doc)
walls = collector.OfClass(DB.Wall).ToElements()

# Debug Console during pause:
# >>> len(list(walls))
# >>> walls[0].Name
# >>> walls[0].GetType().Namefrom Autodesk.Revit import DB
doc = __revit__.ActiveUIDocument.Document
wall = doc.GetElement(DB.ElementId(123456))
# Set breakpoint here
params = wall.Parameters
# Inspect in Variables panel:
# - Expand 'params' to see all parameters
# - Hover over individual parameters
# - Check 'param.Definition.Name'from Autodesk.Revit import DB
doc = __revit__.ActiveUIDocument.Document
wall = doc.GetElement(DB.ElementId(123456))
# Set breakpoint here
curve = wall.Location.Curve
start = curve.GetEndPoint(0)
end = curve.GetEndPoint(1)
# Inspect geometry:
# - Check 'start.X', 'start.Y', 'start.Z'
# - Verify 'curve.Length'
# - Test transformations in Debug Consolefrom Autodesk.Revit import DB
doc = __revit__.ActiveUIDocument.Document
try:
# Set breakpoint here
element = doc.GetElement(DB.ElementId(999999))
name = element.Name # May throw if element is None
except Exception as e:
# Set breakpoint here to inspect exception
print(f"Error: {e}")
# Debug Console: Check 'type(e)', 'str(e)'Symptoms:
- Status indicator stays red 🔴
- VSCode shows "Connection refused"
- Timeout when attaching
Solutions:
-
Check port availability:
netstat -ano | findstr :5678
If port is in use, change port in RevitDevTool Settings
-
Verify debugpy installation:
- Check Trace panel for debugpy setup logs
- Look for "Debugpy listening on port 5678" message
-
Restart Revit:
- Close Revit completely
- Relaunch and try again
-
Check firewall:
- Allow Python.exe through Windows Firewall
- Allow localhost connections on configured port
Symptoms:
- Breakpoints show as gray (not red)
- Script executes without pausing
- "Breakpoint in file that does not exist" warning
Solutions:
-
Verify VSCode is attached:
- Check green dot 🟢 in Trace panel
- VSCode Debug toolbar should be visible
-
Check path mappings:
"pathMappings": [
  {
    "localRoot": "${workspaceFolder}",
    "remoteRoot": "${workspaceFolder}"
  }
]
Ensure paths match your script location
-
Use absolute paths:
- Open script folder as VSCode workspace root
- Avoid nested folders in pathMappings
-
Set
justMyCode: false:"justMyCode": false
Allows debugging into libraries
Symptoms:
- Variables panel empty
- Hover shows no information
- Objects show as
<PyObject>
Solutions:
-
Use Debug Console:
- Type variable names directly
- Access properties:
wall.Name,doc.Title - Call methods:
element.GetType().Name
-
Check call stack:
- Click different frames in Call Stack panel
- Variables change per frame
-
Expand collections:
- Click arrow next to collection variables
- May take time for large collections
-
Revit API objects:
- Some show as
<PyObject>(expected) - Access properties directly in Debug Console
- Some show as
Symptoms:
- Slow stepping through code
- UI freezes during debugging
- Long pauses between steps
Solutions:
-
Use conditional breakpoints:
- Instead of breaking every iteration
- Only break when condition is true
-
Disable breakpoints:
- Right-click breakpoint → Disable
- Or uncheck in Breakpoints panel
-
Detach when done:
- Press Shift+F5 to detach
- Or click Stop in Debug toolbar
-
Limit collection inspection:
- Don't expand large collections in Variables panel
- Use Debug Console for specific items
Good:
# Set breakpoint before critical operations
result = complex_calculation(data)  # ← Breakpoint here
print(result)
Avoid:
# Don't set breakpoints in tight loops
for i in range(10000):
process(i) # ← Avoid breakpoint here (too slow)Instead of:
for wall in walls:
    if wall.Id.IntegerValue == 123456:
        print(wall.Name)  # ← Breakpoint here
Use conditional breakpoint:
for wall in walls:
print(wall.Name) # ← Conditional: wall.Id.IntegerValue == 123456During pause, test expressions:
# In Debug Console:
>>> wall.Name
'Basic Wall'
>>> wall.GetType().Name
'Wall'
>>> dir(wall)  # See all available methods
[...]Pattern:
element = doc.GetElement(element_id)

# Set breakpoint here
# In Debug Console:
>>> element.Category.Name
>>> element.Parameters.Size
>>> [p.Definition.Name for p in element.Parameters]Before production:
- Remove all breakpoints (Ctrl+Shift+F9)
- Detach debugger (Shift+F5)
- Test script runs normally without debugger
Minimal when not attached:
- debugpy listener runs in background
- No performance impact on script execution
- Status check is lightweight
Moderate when attached:
- Slight slowdown during execution (expected)
- Stepping through code is slower (by design)
- Variable inspection may take time for large objects
Best practices:
- Attach only when debugging needed
- Detach when done (Shift+F5)
- Use conditional breakpoints for loops
debugpy memory usage:
- ~10-20 MB when listener is active
- Additional memory during debugging session
- Released when debugger detaches
Large collections:
- Avoid expanding huge collections in Variables panel
- Use Debug Console for specific items
- Consider filtering data before inspection
| Feature | RevitDevTool | pyRevit |
|---|---|---|
| Debugger | VSCode debugpy | Limited (print debugging) |
| Breakpoints | Full support | Not available |
| Variable inspection | Full VSCode UI | Print statements only |
| Step through code | Yes (F10, F11) | No |
| Python version | Python 3.13 | IronPython 2.7 |
| IDE integration | Native VSCode | External tools only |
| Feature | Python Debugging | C# Add-in Debugging |
|---|---|---|
| Setup | Launch config only | Visual Studio project |
| Attach time | Instant (F5) | Attach to process |
| Restart required | No | Yes (after code changes) |
| Breakpoints | Full support | Full support |
| Performance | Slight overhead | Native speed |
| Ease of use | Very easy | Moderate |
- Python Runtime - Complete Python execution mechanism
- Stub Generation - IDE autocomplete setup
- vs pyRevit - Comparison with pyRevit
- CodeExecute Overview - Module overview
Try the included demo script to test debugging:
File: source/RevitDevTool.PythonDemo/commands/debugpy_script.py
# /// script
# dependencies = [
#     "numpy",
# ]
# ///

from Autodesk.Revit import UI

uidoc : UI.UIDocument = __revit__.ActiveUIDocument
sel_ids = uidoc.Selection.GetElementIds()

for eid in sel_ids:
    el = uidoc.Document.GetElement(eid)
    print(el.Id, el.Name)
Steps:
- Select some elements in Revit
- Set breakpoint on line 12 (
for eid in sel_ids:) - Attach debugger (F5 in VSCode)
- Execute script in RevitDevTool
- Inspect
sel_ids,eid,elvariables - Step through loop (F10)