Performance Tools
Several tools are available on Piz Daint:
Nvidia nsight
- NVIDIA® Nsight™ Systems is a system-wide performance analysis tool.
To use nsight on Piz Daint, load the modulefile:
module load daint-gpu
module load nvidia-nsight-systems  #  this will load version 2019.5.1

nsys -v
    NVIDIA Nsight Systems version 2019.5.1.58-5e791f0

which nsys
    /apps/daint/UES/jenkins/6.0.UP07/gpu/easybuild/tools/software/nvidia-nsight-systems/2019.5.1/bin/nsys
You may want to install the client on your laptop from:
https://developer.nvidia.com/gameworksdownload#?dn=nsight-systems-2019-5
For further information check the documentation:
or read further:
nsys with mpi+cuda
- Load the modulefiles
module load daint-gpu
module unload PrgEnv-cray
module load PrgEnv-gnu
module load craype-accel-nvidia60
module load nvidia-nsight-systems/2019.5.1
- Compile and link your code with cuda
- Add nsys to your jobscript
srun -n 2 \
nsys profile --force-overwrite=true \
-o %h.%q{SLURM_NODEID}.%q{SLURM_PROCID}.qdstrm \
--trace=cuda,mpi,nvtx --mpi-impl=mpich \
--stats=true --delay=2 ./exe
nsys will generate 1 output file per mpi rank:
nid02006.0.0.qdrep
nid02007.1.1.qdrep
- A typical text report (
--stats=true) will look like:
CUDA Kernel Statistics (nanoseconds)

Time(%)      Total Time   Instances         Average         Minimum         Maximum  Name

-------  --------------  ----------  --------------  --------------  --------------
   49.0       107152611          88       1217643.3         1167541         1268020  density

   31.4        68693840          22       3122447.3         3092163         3160322  computeMomentumAndEnergyIAD

   19.5        42635403          22       1937972.9         1839759         2163115  computeIAD


CUDA Memory Operation Statistics (nanoseconds)

Time(%)      Total Time  Operations         Average         Minimum         Maximum  Name

-------  --------------  ----------  --------------  --------------  --------------
   98.9       135778347        1078        125953.9             896        15181550  [CUDA memcpy HtoD]

    1.1         1502834         308          4879.3            1760            7776  [CUDA memcpy DtoH]


CUDA Memory Operation Statistics (KiB)

            Total      Operations            Average            Minimum            Maximum  Name

-----------------  --------------  -----------------  -----------------  -----------------
        1383253.0            1078             1283.2              0.055            20312.0  [CUDA memcpy HtoD]

          15125.0             308               49.1             15.625               62.0  [CUDA memcpy DtoH]
etc...
- Transfer the files to your laptop and open them in the client to get a graphical report:
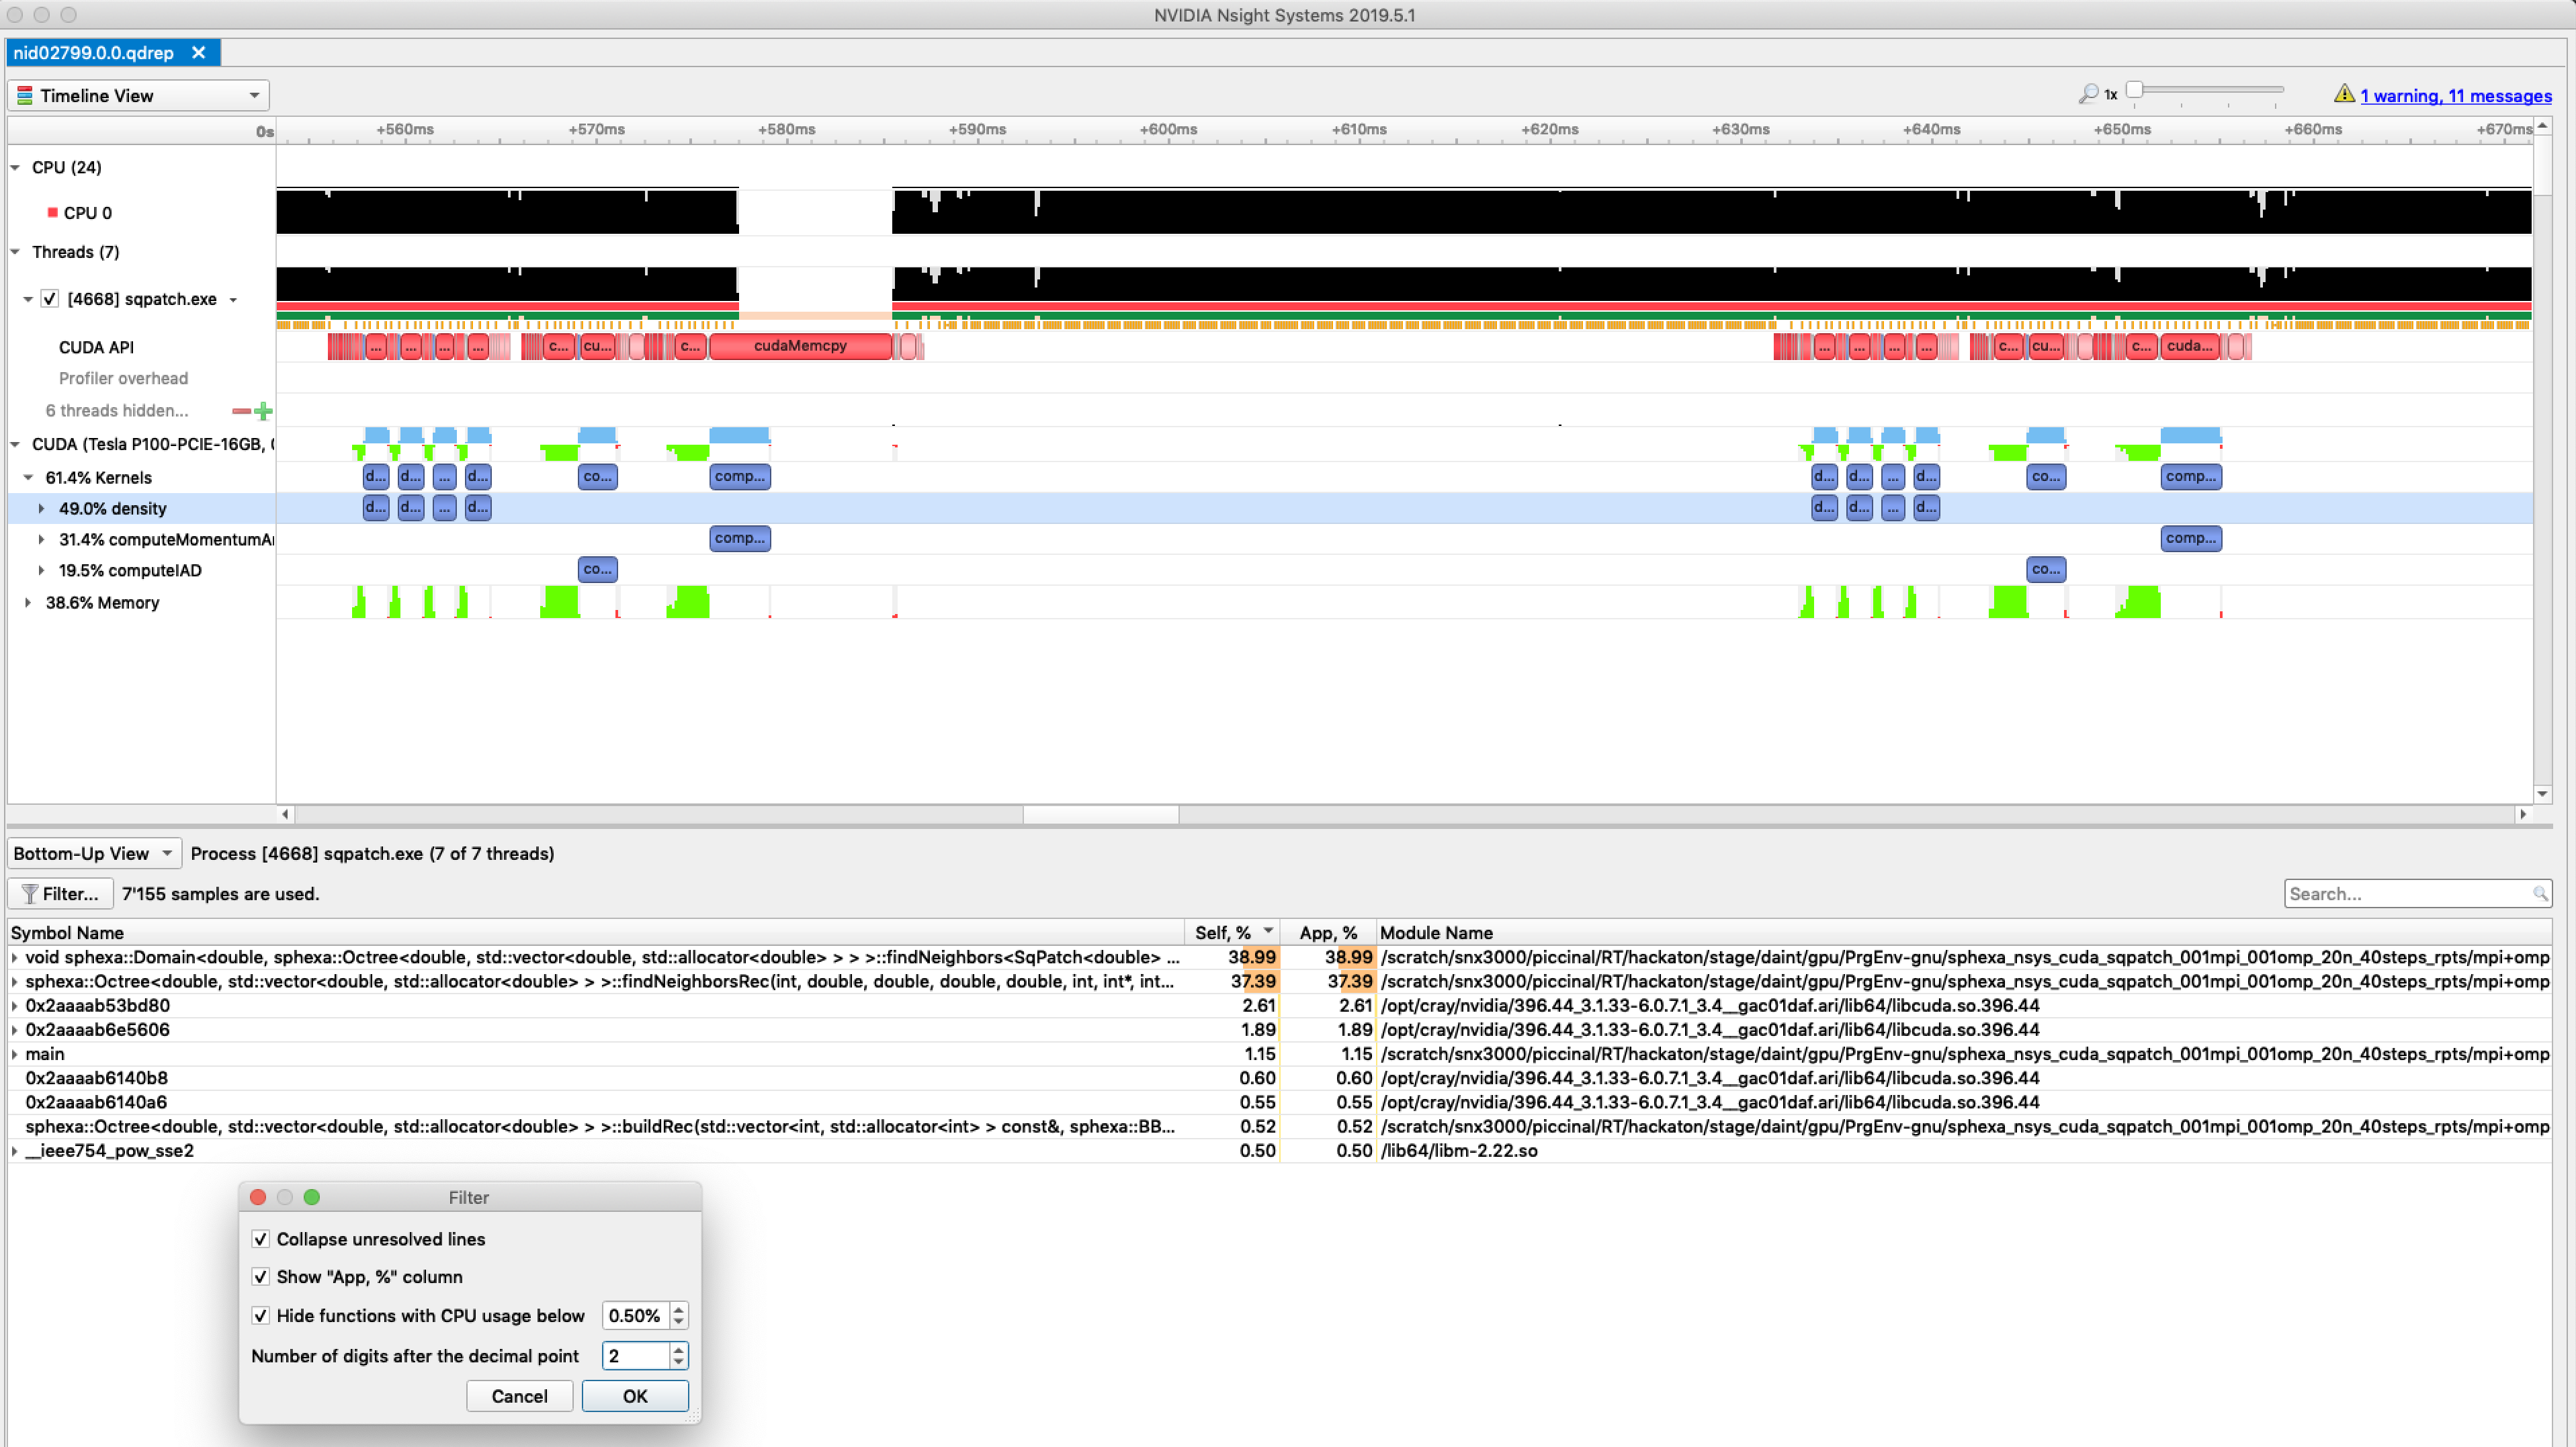
nsys with mpi+openacc
- Load the modulefiles
module load daint-gpu
module unload PrgEnv-cray
module load PrgEnv-pgi
module load craype-accel-nvidia60
module load nvidia-nsight-systems/2019.5.1
- Compile and link your code with openacc
We noticed an issue with the Cray wrapper scripts (ftn, cc, CC) when compiling OpenACC codes. A workaround is to set the right PATH at compilation time before loading PrgEnv-pgi:
export PATH=$CRAY_BINUTILS_BIN:$PATH
- Add nsys to your jobscript
srun -n 2 \
nsys profile --force-overwrite=true \
-o %h.%q{SLURM_NODEID}.%q{SLURM_PROCID}.qdstrm \
--trace=openacc,mpi,nvtx --mpi-impl=mpich \
--stats=true --delay=2 ./exe
nsys will generate 1 output file per mpi rank:
nid02010.0.0.qdrep
nid02011.1.1.qdrep
- A typical text report (
--stats=true) will look like:
Generating CUDA API Statistics...
CUDA API Statistics (nanoseconds)

Time(%)      Total Time       Calls         Average         Minimum         Maximum  Name

-------  --------------  ----------  --------------  --------------  --------------  -------------------------------------------------------------
-------------------
   85.5       175270396         273        642016.1            1794        11153499  cuStreamSynchronize

    9.1        18642361           1      18642361.0        18642361        18642361  cuMemFreeHost

    2.8         5791079         903          6413.2            4250           44709  cuMemcpyHtoDAsync_v2

    1.2         2497245          63         39638.8           11233         1699528  cuLaunchKernel

    0.7         1357685         273          4973.2            3433           19312  cuMemcpyDtoHAsync_v2

    0.4          746224         399          1870.2            1232           15760  cuEventSynchronize

    0.3          620821         400          1552.1            1107           16844  cuEventRecord

    0.0            2125           1          2125.0            2125            2125  cuEventCreate


Generating CUDA Kernel Statistics...

Generating CUDA Memory Operation Statistics...
CUDA Kernel Statistics (nanoseconds)

Time(%)      Total Time   Instances         Average         Minimum         Maximum  Name

-------  --------------  ----------  --------------  --------------  --------------  -------------------------------------------------------------
-------------------
   49.5        42597382          21       2028446.8         2024873         2031945  computeMomentumAndEnergyIADImpl_189_gpu

   37.0        31846715          21       1516510.2         1512559         1519919  computeIADImpl_58_gpu

   13.5        11639164          21        554245.9          551514          556569  computeDensity_74_gpu


CUDA Memory Operation Statistics (nanoseconds)

Time(%)      Total Time  Operations         Average         Minimum         Maximum  Name

-------  --------------  ----------  --------------  --------------  --------------  -------------------------------------------------------------
-------------------
   98.7       109746976         903        121536.0             864         1345969  [CUDA memcpy HtoD]

    1.3         1389679         273          5090.4            1024           11840  [CUDA memcpy DtoH]


CUDA Memory Operation Statistics (KiB)

            Total      Operations            Average            Minimum            Maximum  Name

-----------------  --------------  -----------------  -----------------  -----------------  ------------------------------------------------------
--------------------------
        1320377.0             903             1462.2              0.008            16384.0  [CUDA memcpy HtoD]

          14439.0             273               52.9              0.055               62.0  [CUDA memcpy DtoH]
etc...
- Transfer the files to your laptop and open them in the client to get a graphical report:
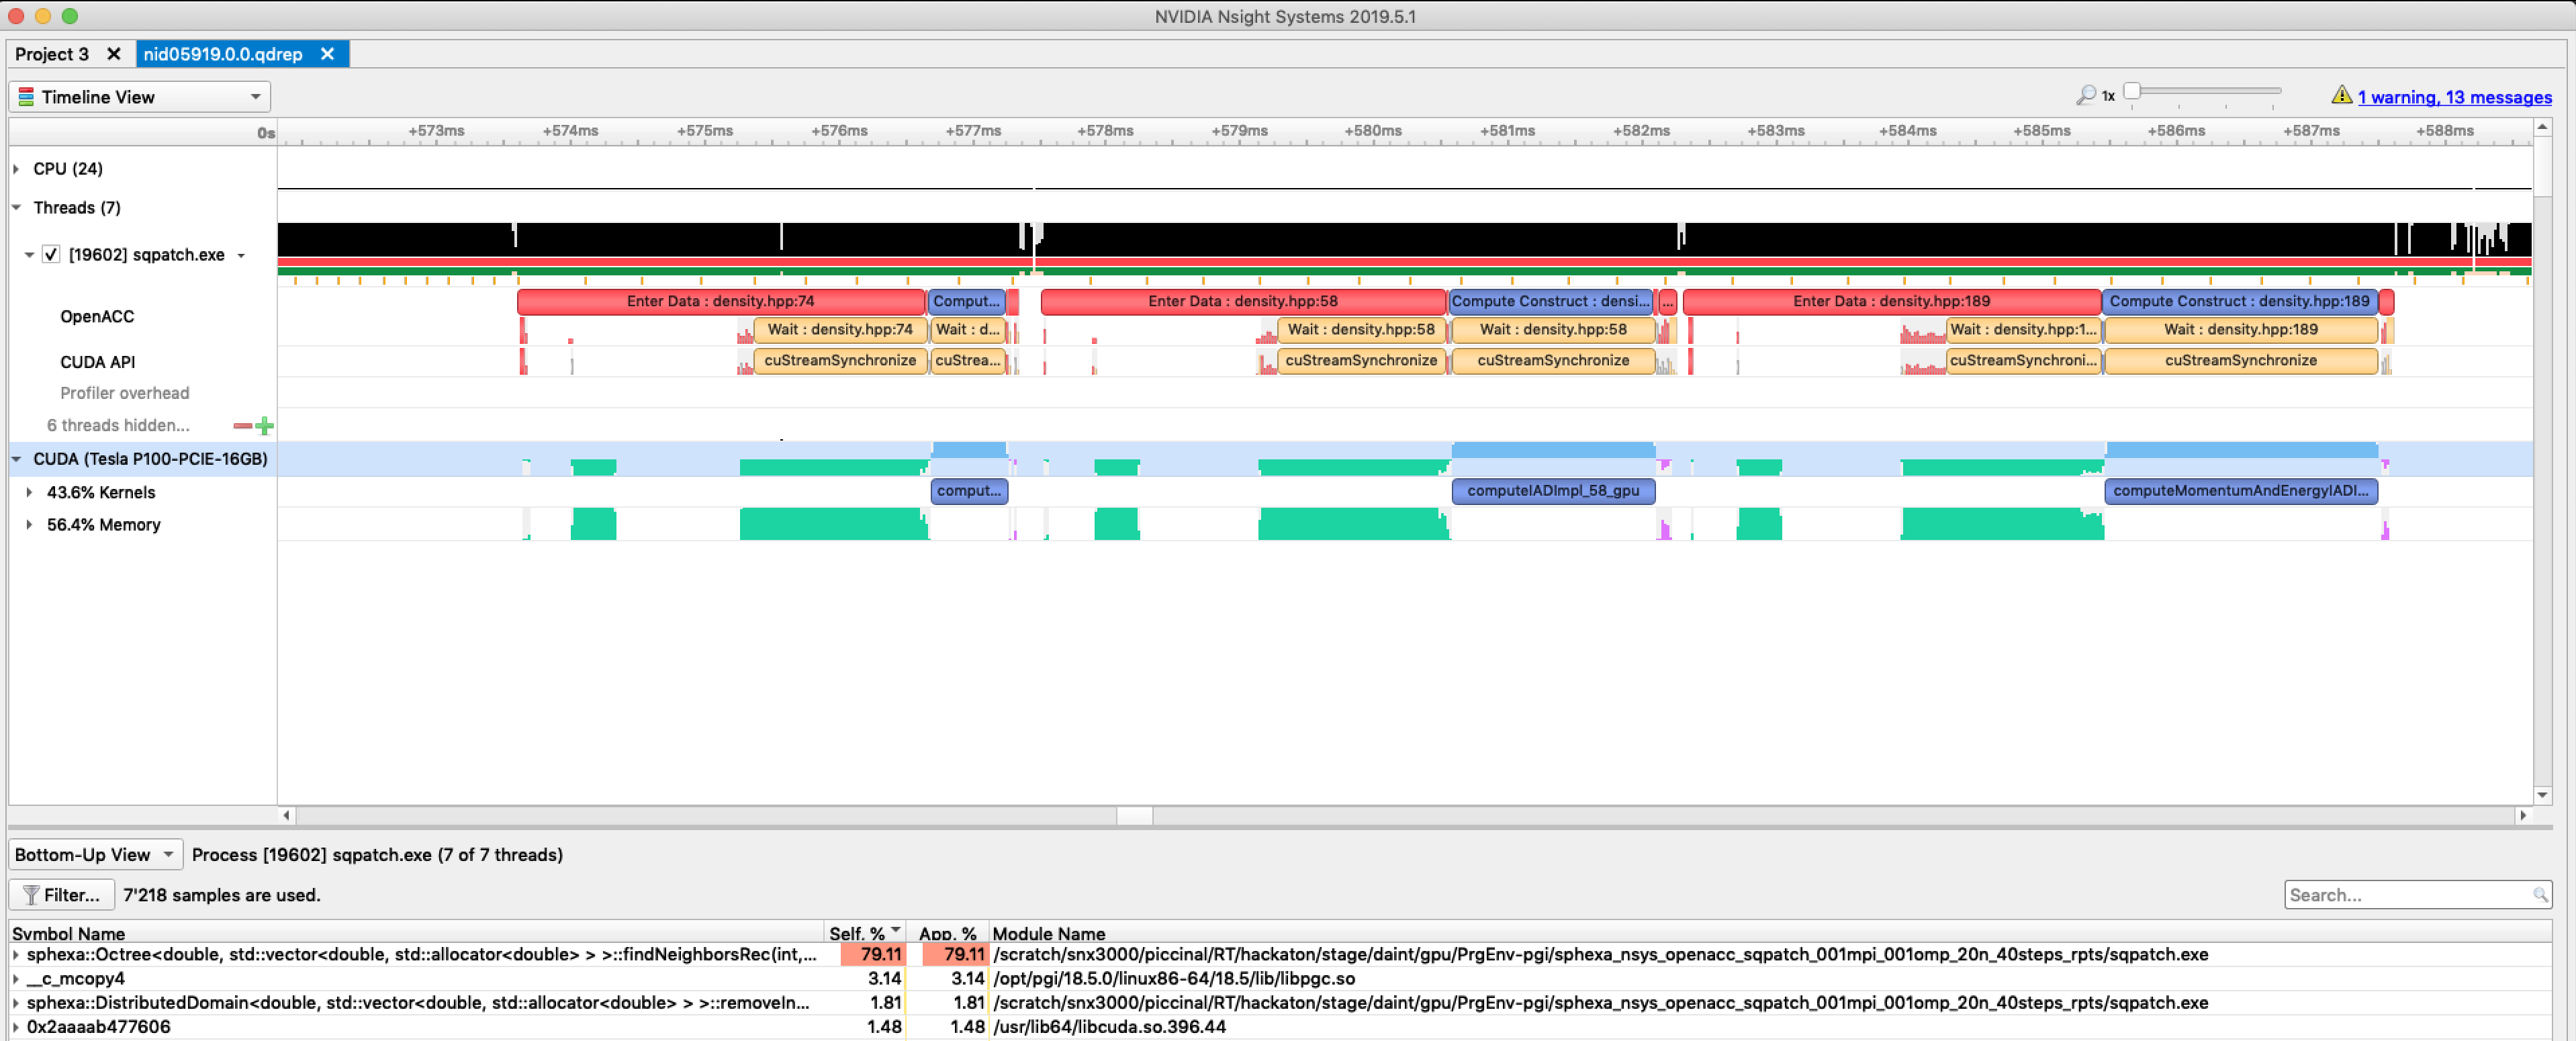
Nvidia nvprof
- NVIDIA nvprof is CUDA standard performance tool.
To use nvprof on Piz Daint, load the cudatoolkit:
module load craype-accel-nvidia60
module swap cudatoolkit/9.2.148_3.19-6.0.7.1_2.1__g3d9acc8

nvprof -V
    nvprof: NVIDIA (R) Cuda command line profiler
    Copyright (c) 2012 - 2018 NVIDIA Corporation
    Release version 9.2.148 (21)
For further information check the documentation:
or read further:
nvprof with mpi+cuda
- Load the modulefiles
- Compile and link your code with cuda
- Add nvprof to your jobscript
srun nvprof \
  -o nvprof.%h.%p.%q{SLURM_NODEID}.%q{SLURM_PROCID} \
  ./exe 2>&1
- nvprof will generate 1 output file per mpi rank:
nvprof.nid03508.11812.0.0
nvprof.nid03509.7667.1.1
- Text report with nvprof:
nvprof -i nvprof.nid03508.11812.0.0
- A typical report will look like:
======== Profiling result:
            Type  Time(%)      Time     Calls       Avg       Min       Max  Name
 GPU activities:   46.13%  38.352ms         8  4.7940ms  4.7418ms  4.8599ms  void cuda::momenumAndEnergy
                   39.92%  33.189ms        84  395.11us     896ns  2.0940ms  [CUDA memcpy HtoD]
                   13.64%  11.341ms         8  1.4177ms  1.3868ms  1.4743ms  void cuda::density
                    0.31%  261.44us        40  6.5350us  5.8240us  12.608us  [CUDA memcpy DtoH]
      API calls:   76.98%  310.71ms        58  5.3571ms  2.6920us  308.81ms  cudaMalloc
                   21.58%  87.084ms       124  702.29us  10.153us  4.8844ms  cudaMemcpy
                    1.15%  4.6426ms        58  80.045us  3.0450us  803.70us  cudaFree
                    0.15%  586.09us         1  586.09us  586.09us  586.09us  cuDeviceTotalMem
                    0.07%  291.41us        16  18.213us  13.658us  34.499us  cudaLaunchKernel
                    0.07%  268.56us        97  2.7680us     105ns  109.25us  cuDeviceGetAttribute
                    0.01%  26.828us         1  26.828us  26.828us  26.828us  cuDeviceGetName
                    0.00%  3.9620us        16     247ns     167ns     416ns  cudaGetLastError
                    0.00%  2.5690us         1  2.5690us  2.5690us  2.5690us  cuDeviceGetPCIBusId
                    0.00%  1.3230us         3     441ns     119ns     736ns  cuDeviceGetCount
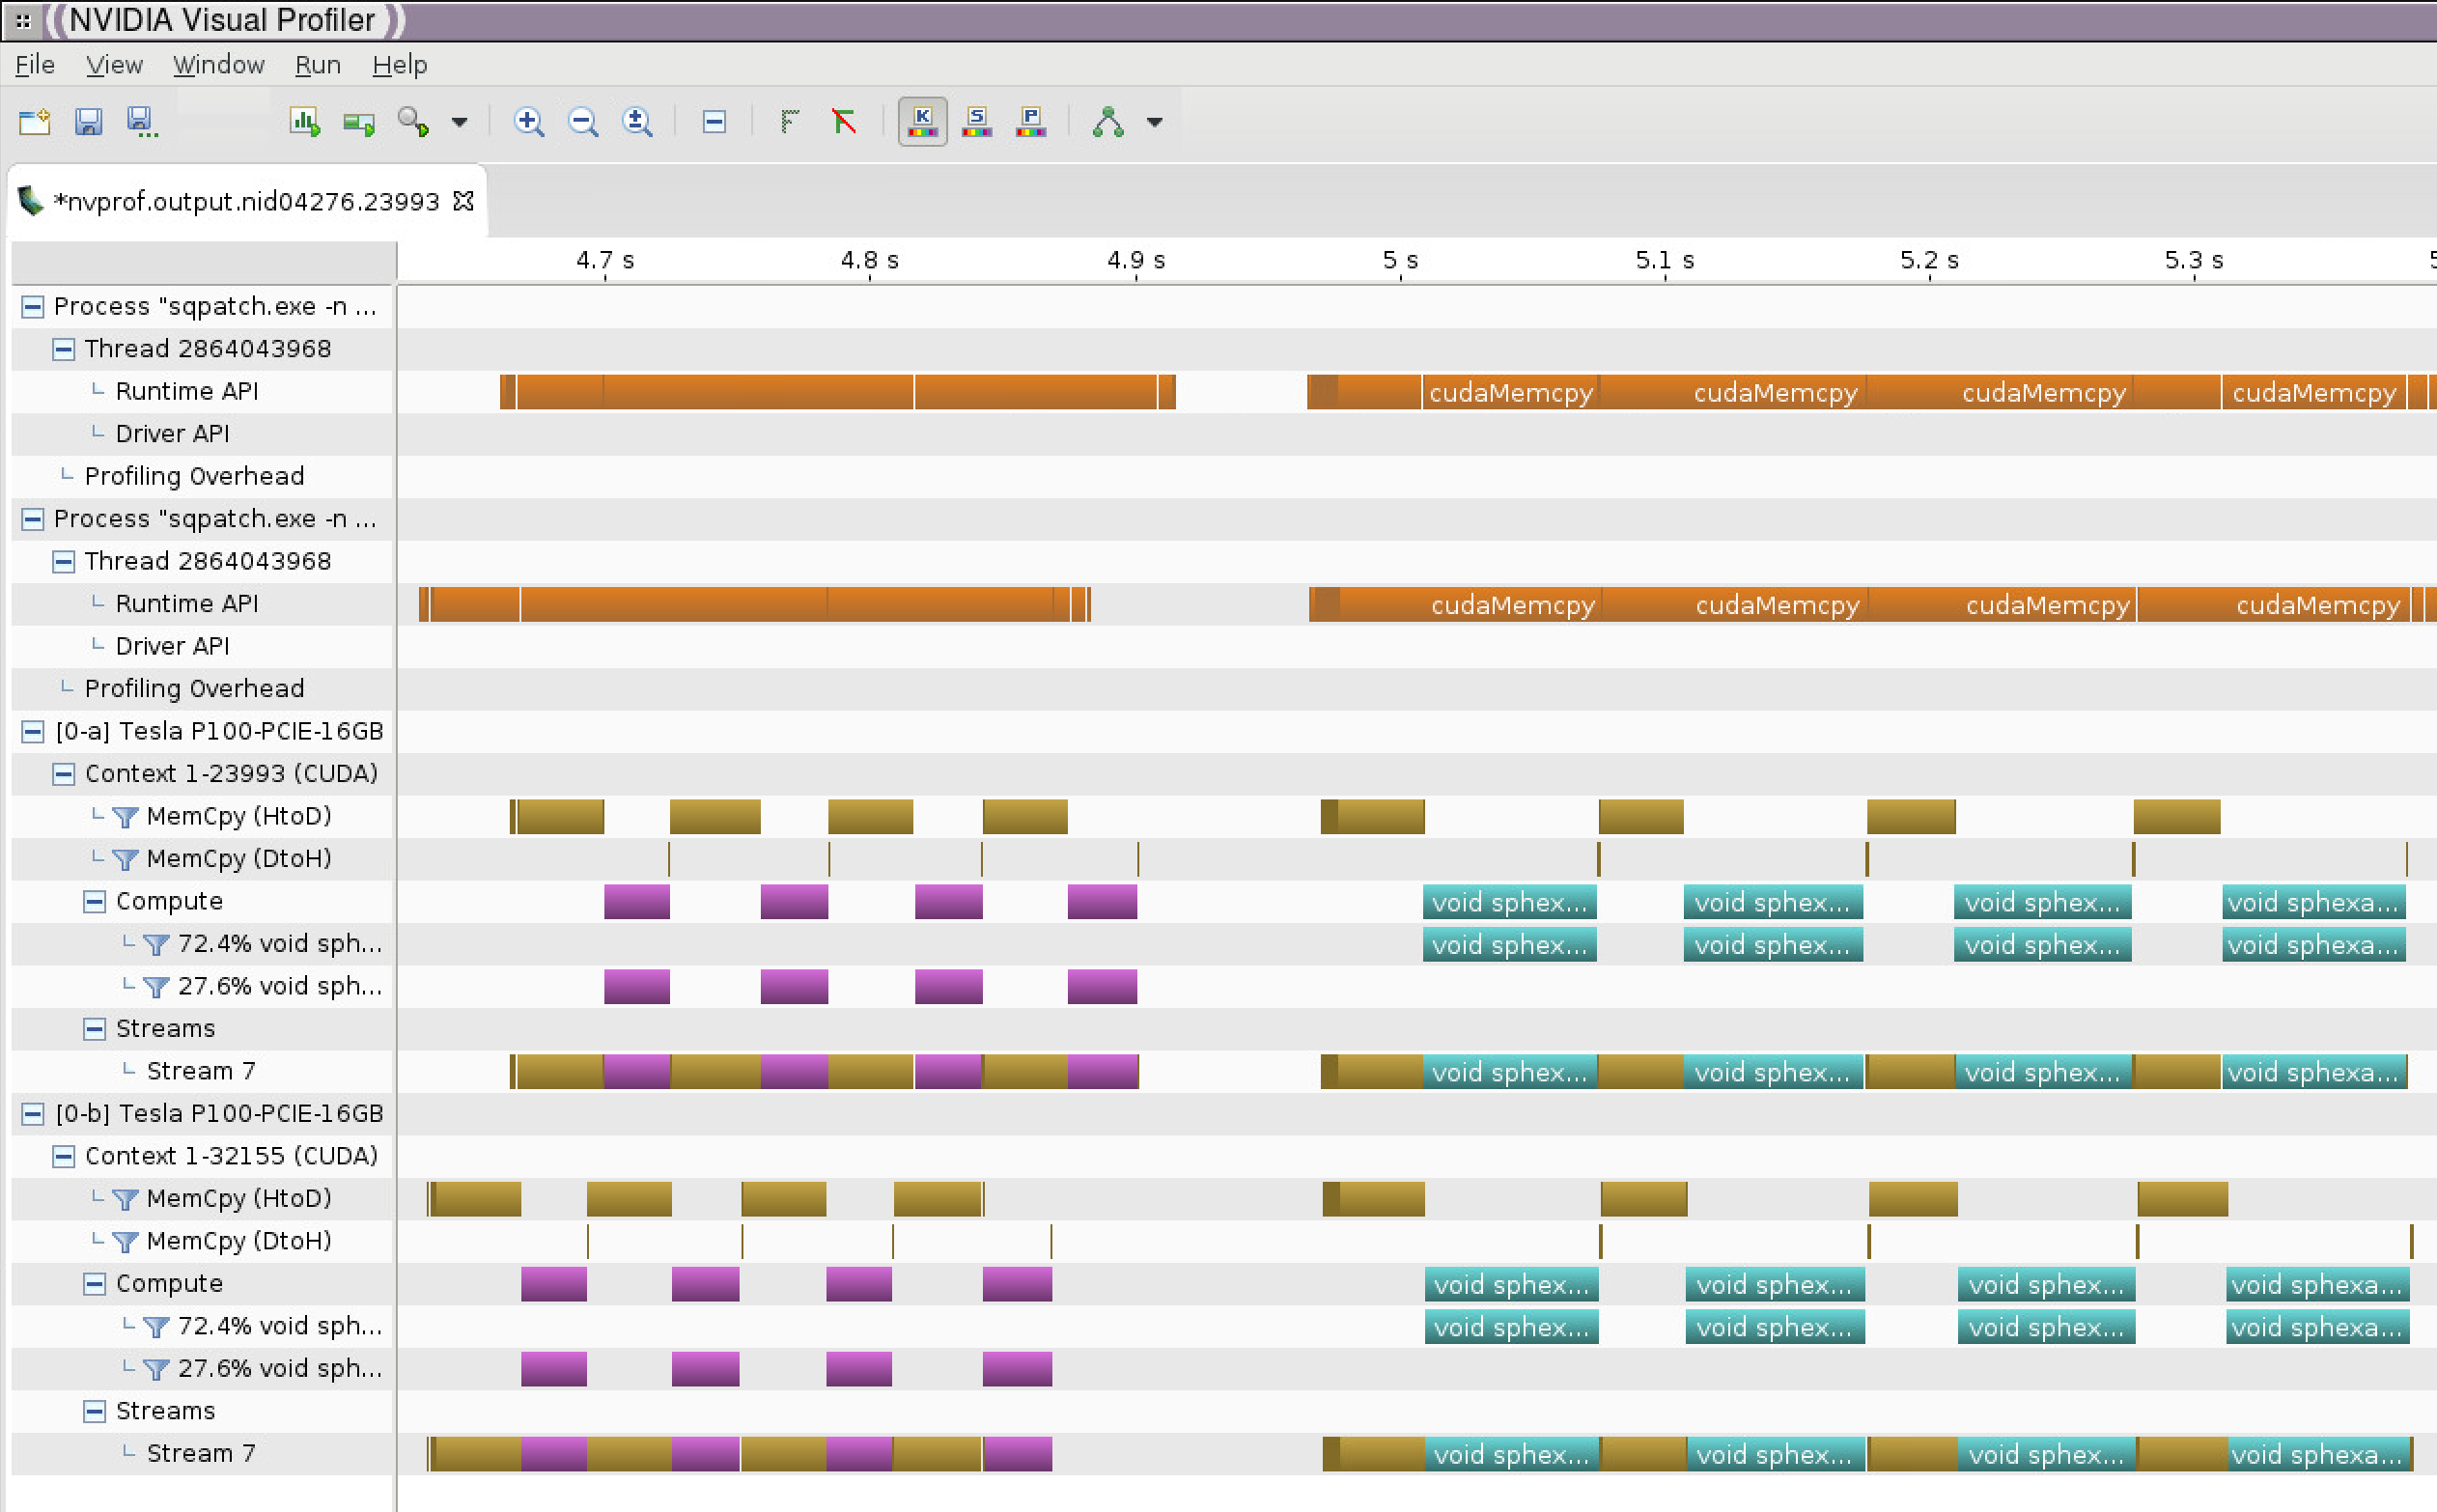
- Graphical report with nvvp (requires X11 or VNC or scp):
nvvp &
Menu -> Import
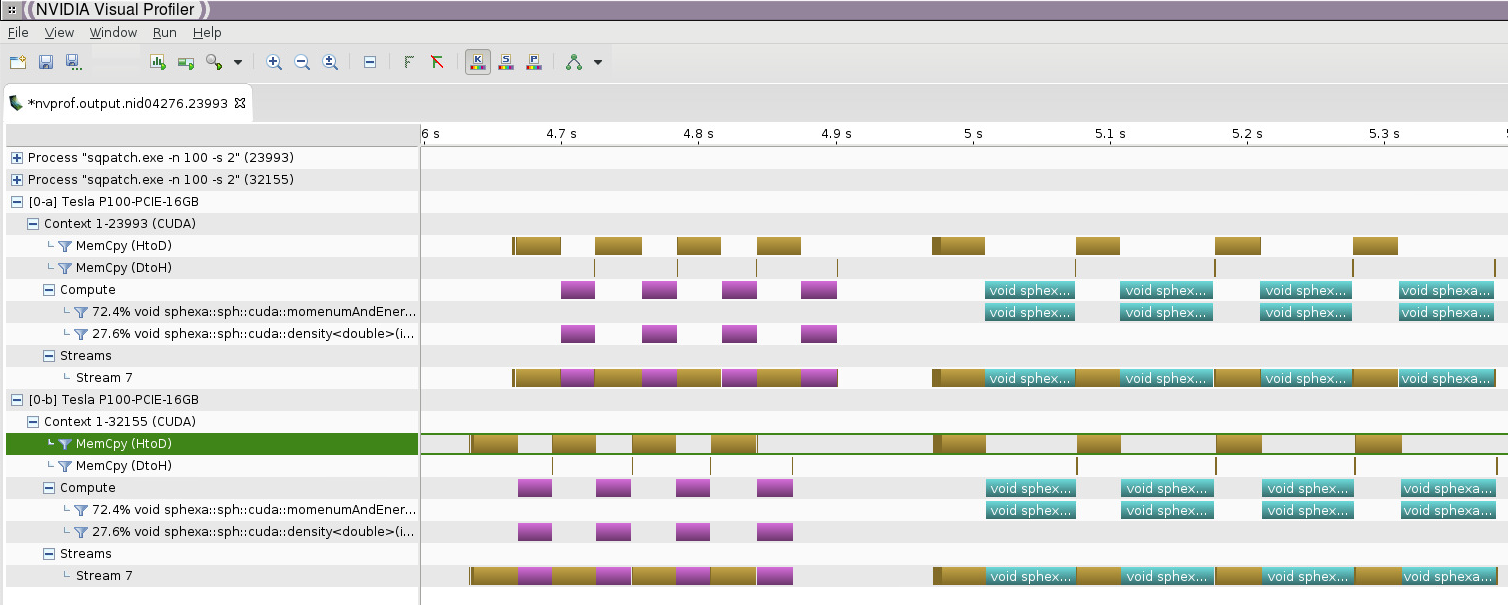
nvprof with mpi+openacc
- Load the modulefiles
- Compile and link your code with pgi and openacc
We noticed an issue with the Cray wrapper scripts (ftn, cc, CC) when compiling OpenACC codes for nvprof. A workaround is to set the right PATH at compilation time before loading PrgEnv-pgi:
export PATH=$CRAY_BINUTILS_BIN:$PATH
If not set, nvprof will display this message at runtime:
======== Profiling result:
No kernels were profiled.
No API activities were profiled.
- Add nvprof to your jobscript
srun nvprof \
  -o nvprof.%h.%p.%q{SLURM_NODEID}.%q{SLURM_PROCID} \
  ./exe 2>&1
nvprof will generate 1 output file per mpi rank:
nvprof.nid03508.11813.0.0
nvprof.nid03509.7668.1.1
- Text report with nvprof:
nvprof -i nvprof.nid03508.11813.0.0
- A typical report will look like:
======== Profiling result:
            Type  Time(%)      Time     Calls       Avg       Min       Max  Name
 GPU activities:   53.82%  63.027ms       156  404.02us     896ns  1.3470ms  [CUDA memcpy HtoD]
                   22.65%  26.532ms         3  8.8439ms  8.7749ms  8.8983ms
                   void sphexa::sph::computeMomentumAndEnergyIADImpl_189_gpu<double, SqPatch<double>>(std::vector<int, std::allocator<int>> const &, double&)
                   16.85%  19.740ms         3  6.5799ms  6.4749ms  6.7702ms
                    void sphexa::sph::computeIADImpl_58_gpu<double, SqPatch<double>>(std::vector<int, std::allocator<int>> const &, double&)
                    6.10%  7.1390ms         3  2.3797ms  2.3748ms  2.3872ms
                    void sphexa::sph::computeDensity_74_gpu<double, SqPatch<double>>(std::vector<int, std::allocator<int>> const &, double&)
                    0.58%  678.56us        39  17.398us  1.0240us  21.056us  [CUDA memcpy DtoH]
      API calls:   57.07%  312.06ms         1  312.06ms  312.06ms  312.06ms  cuDevicePrimaryCtxRetain
                   19.39%  106.03ms         1  106.03ms  106.03ms  106.03ms  cuDevicePrimaryCtxRelease
                   etc...
- Graphical report with nvvp (requires X11 or VNC or scp):
nvvp &
Menu -> Import
nvprof options
nvprof --help
  -o,  --export-profile <filename>

Export the result file which can be imported later or opened by the NVIDIA
Visual Profiler.

    "%p" in the file name string is replaced with the process ID of the application being profiled.

    "%q{<ENV>}" in the file name string is replaced with the value of the
environment variable "<ENV>". If the environment variable is not set it is an
error.

    "%h" in the file name string is replaced with the hostname of the system.
By default, this option disables the summary output.
PGI_ACC_TIME with mpi+openacc
- Load the modulefiles
- Compile and link your code with pgi and openacc
- separate the performance data into 1 file per mpi rank by using a wrapper script:
cat tool.sh
#!/bin/bash
export PGI_ACC_TIME=1
./myexe $@ 2> `hostname`.$SLURM_NODEID.$SLURM_PROCID.rpt
and run your executable with:
chmod u+x tool.sh
srun ./tool.sh
PGI_ACC_TIME will generate 1 output file per mpi rank:
nid04276.0.0.rpt
nid04277.1.1.rpt
A typical text report will look like:
cat nid04276.0.0.rpt
Accelerator Kernel Timing data
density.hpp
  _ZN6sphexa3sph14computeDensityId7SqPatchIdEEEvRKSt6vectorIiSaIiEERT0_  NVIDIA  devicenum=0
    time(us): 13,927
    68: compute region reached 2 times
        68: kernel launched 2 times
            grid: [32000]  block: [128]
            elapsed time(us): total=4,580 max=2,300 min=2,280 avg=2,290
    68: data region reached 8 times
        68: data copyin transfers: 28
             device time(us): total=13,857 max=1,352 min=4 avg=494
        111: data copyout transfers: 4
             device time(us): total=70 max=25 min=7 avg=17
PGI_ACC_NOTIFY with mpi+openacc
- Load the modulefiles
- Compile and link your code with pgi and openacc
- separate the performance data into 1 file per mpi rank by using a wrapper script:
cat tool.sh
#!/bin/bash
export PGI_ACC_NOTIFY=3
./myexe $@ 2> `hostname`.$SLURM_NODEID.$SLURM_PROCID.rpt
and run your executable with:
chmod u+x tool.sh
srun ./tool.sh
PGI_ACC_NOTIFY will generate 1 output file per mpi rank:
nid03510.0.0.rpt
nid03511.1.1.rpt
A typical text report will look like:
cat nid03510.0.0.rpt
launch CUDA kernel  file=density.hpp
function=_ZN6sphexa3sph14computeDensityId7SqPatchIdEEEvRKSt6vectorIiSaIiEERT0_
line=68 device=0 threadid=1 num_gangs=32000 num_workers=1 vector_length=128
grid=32000 block=128 shared memory=1024
etc...

download CUDA data  file=density.hpp
function=_ZN6sphexa3sph14computeDensityId7SqPatchIdEEEvRKSt6vectorIiSaIiEERT0_
line=111 device=0 threadid=1 variable=bbox bytes=56
etc...

upload CUDA data  file=density.hpp
function=_ZN6sphexa3sph14computeDensityId7SqPatchIdEEEvRKSt6vectorIiSaIiEERT0_
line=68 device=0 threadid=1 variable=n bytes=8
etc...
COMPUTE_PROFILE
COMPUTE_PROFILE support has been dropped.
Score-P and Vampir
- Score-P is a performance tool developed by the VI-HPS Institute (Virtual Institute for High Productivity Supercomputing). Vampir is a performance visualizer.
For further information check the documentation:
or read further:
Score-P/Vampir with mpi+cuda
To use Score-P with your cuda code on Piz Daint:
- Load the modulefiles (Score-P/4.0-CrayGNU-18.08-cuda-9.1)
- Compile and link your code with the tool (add scorep before the Cray compiler wrapper)
- Add the following variables to your jobscript:
export SCOREP_ENABLE_PROFILING=false
export SCOREP_ENABLE_TRACING=true
export SCOREP_CUDA_ENABLE=yes
More details with:
scorep-info config-vars --full
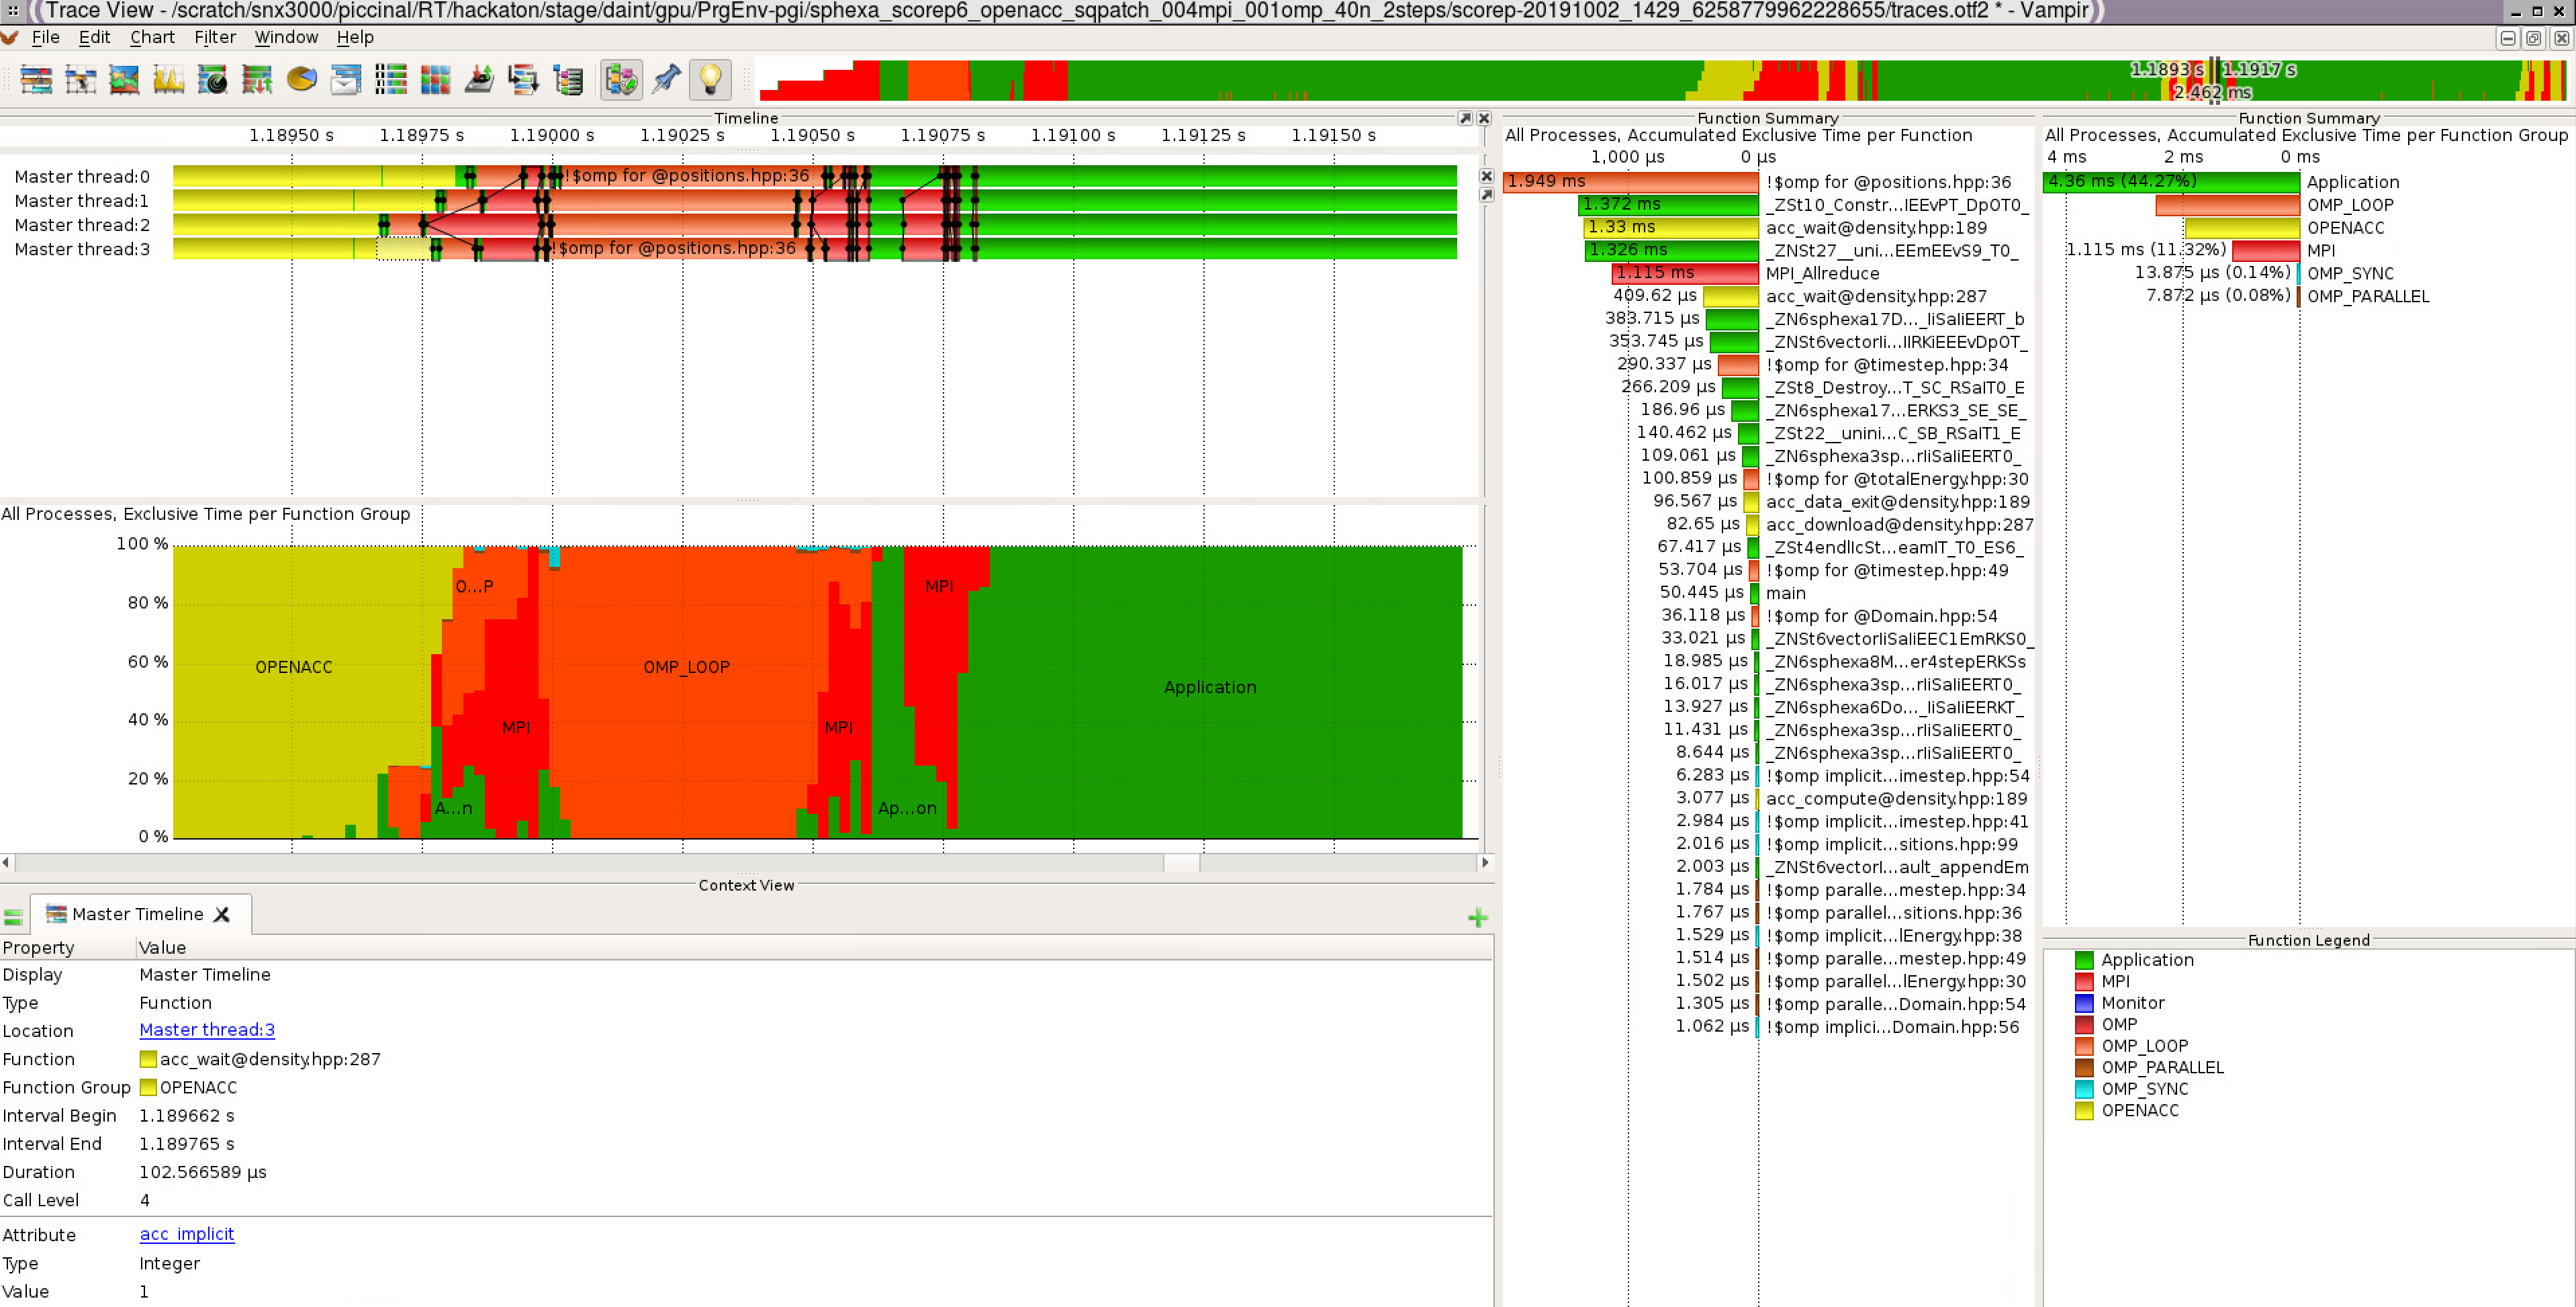
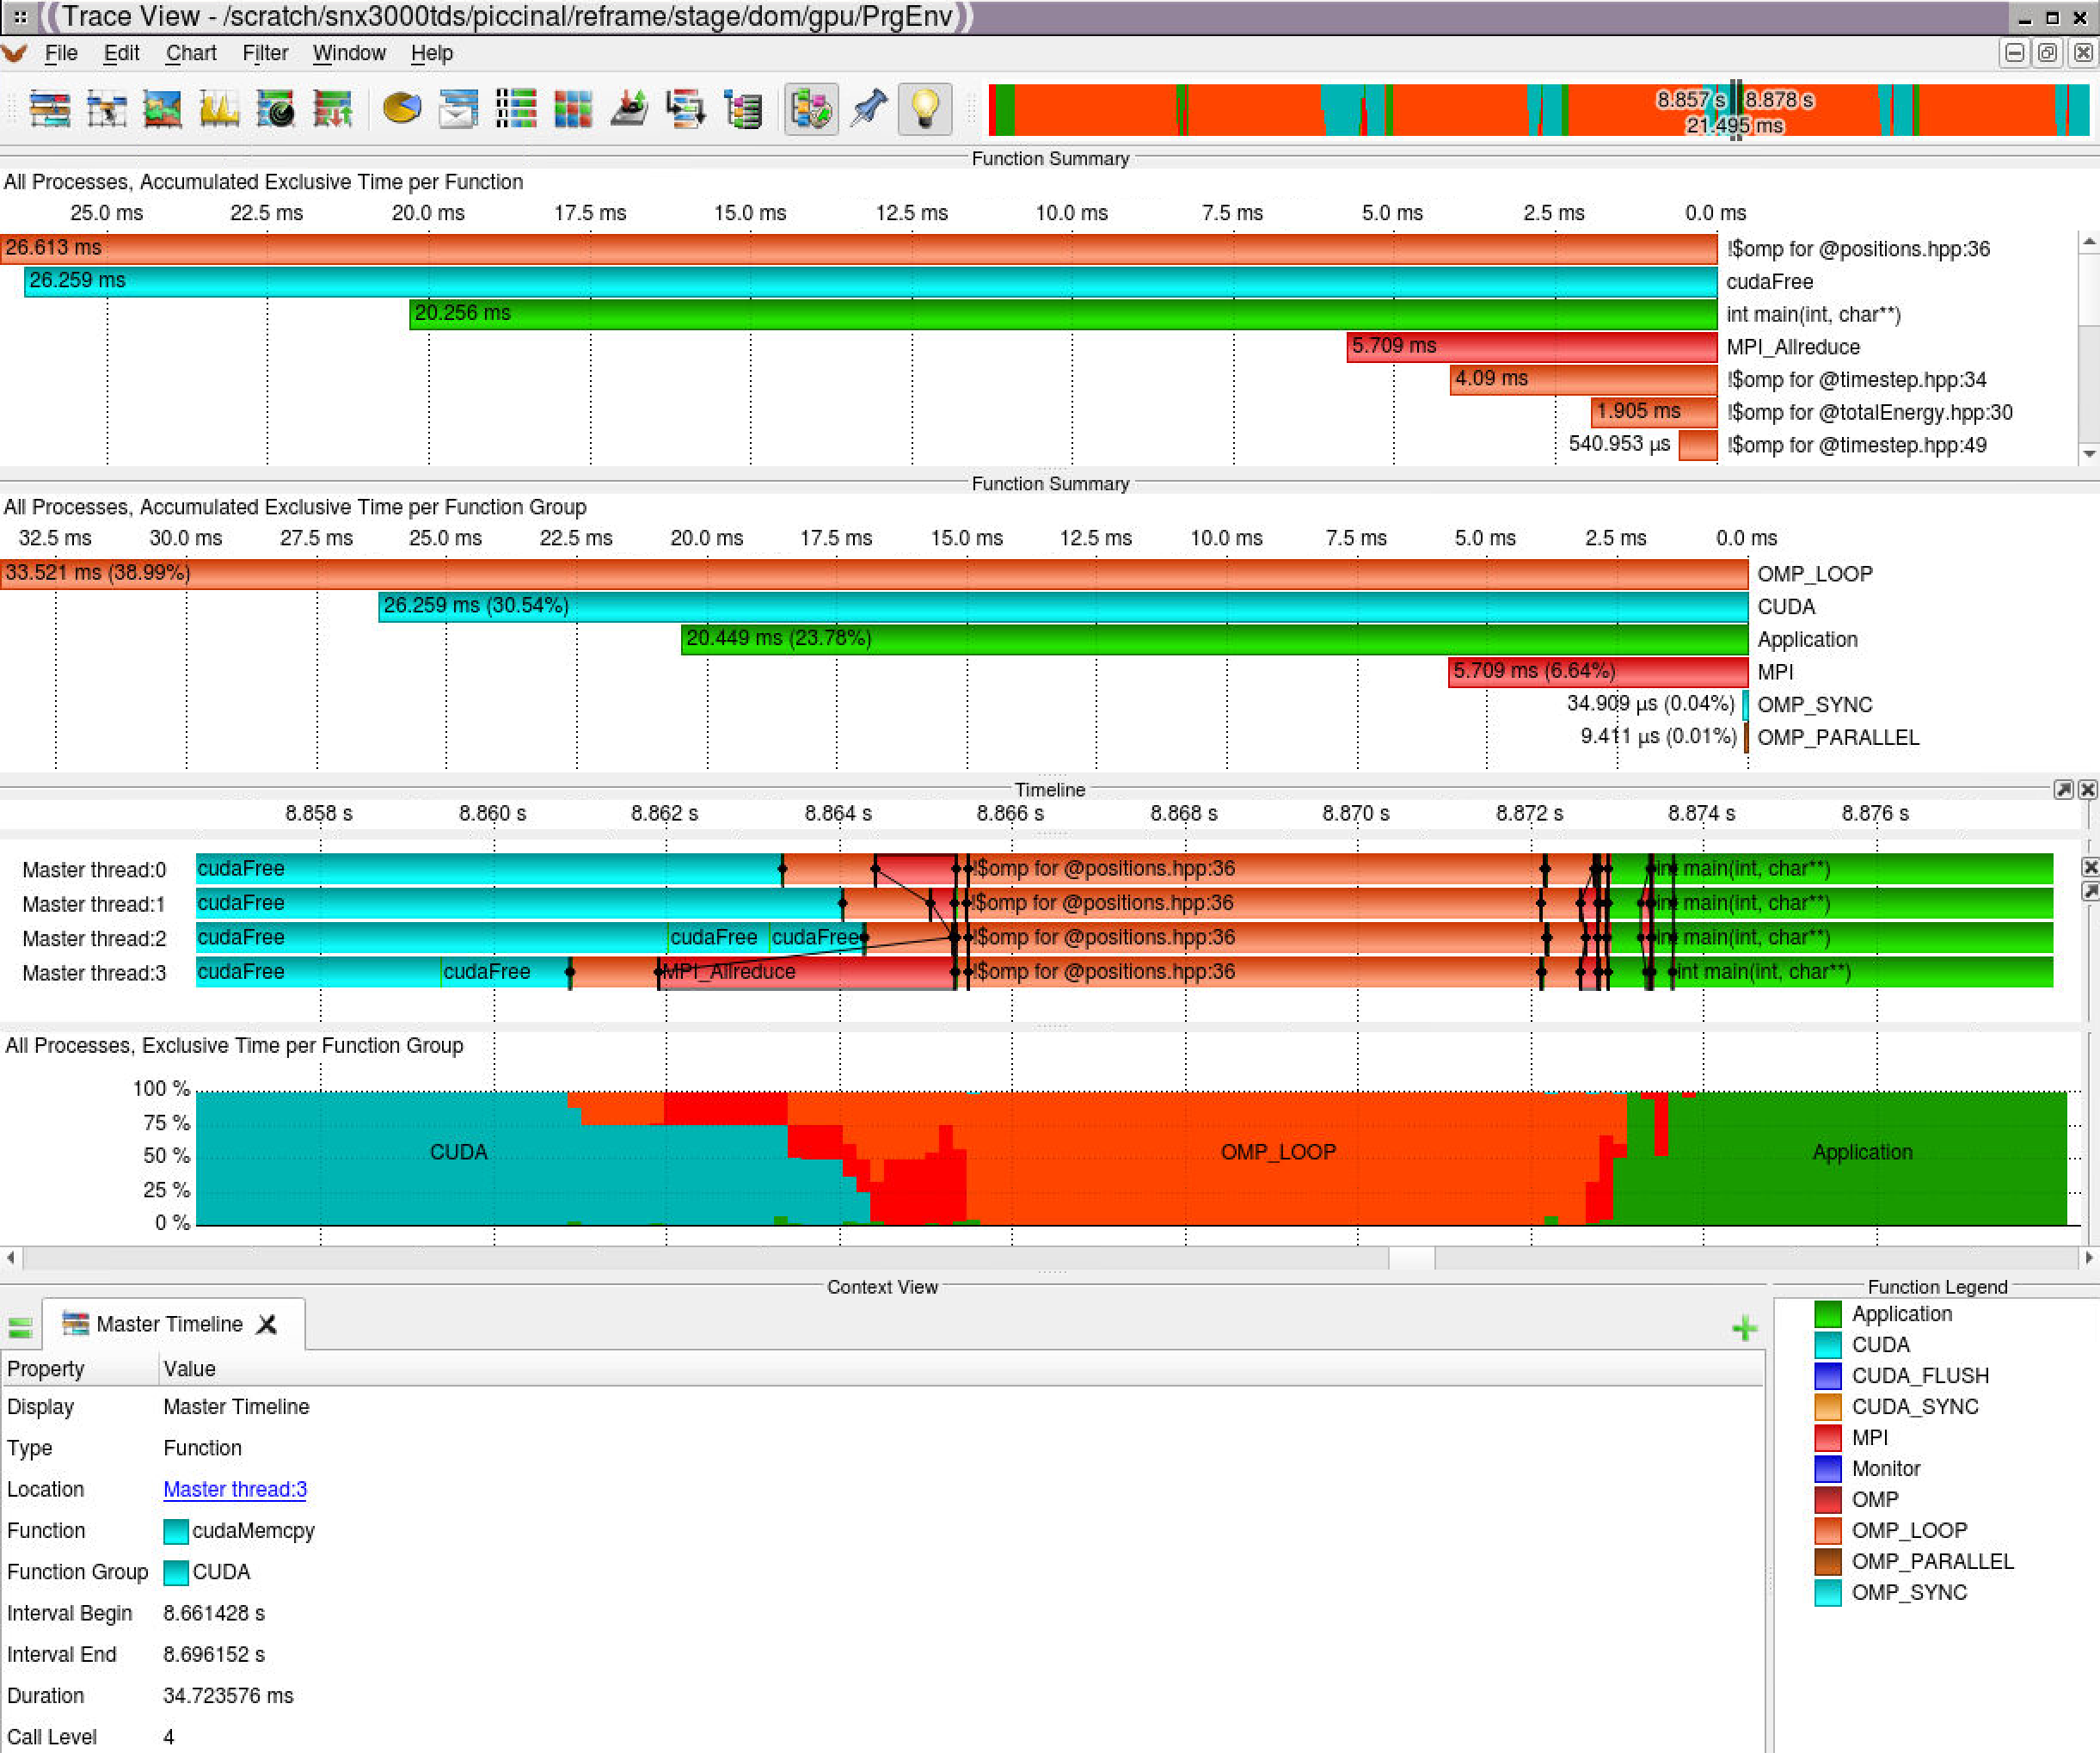
- Graphical report with vampir (requires X11 or VNC or scp):
Score-P/Vampir with mpi+openacc
To use Score-P with your openacc code on Piz Daint:
- Load the modulefiles (Score-P/6.0-CrayPGI-19.eurohack)
- Compile and link your code with the tool (use scorep-CC instead of the CC Cray compiler wrapper)
- Add the following variables to your jobscript:
export SCOREP_WRAPPER_INSTRUMENTER_FLAGS="--mpp=mpi --openacc"
export SCOREP_OPENACC_ENABLE=yes
export SCOREP_ENABLE_PROFILING=false
export SCOREP_ENABLE_TRACING=true
export SCOREP_TOTAL_MEMORY=1GB
More details with:
scorep-info config-vars --full
- Graphical report with vampir (requires X11 or VNC or scp):