Debugging Tools
Several debugging tools are available on Piz Daint:
ARM Forge/DDT
- DDT provides source-level debugging of Fortran, C, and C++ codes. It can be used for debugging serial, multi-threaded (OpenMP), multi-process (MPI) and accelerator based (Cuda, OpenACC) programs. It can be executed either as a graphical user interface (ddt --connect client mode) or from the command-line (ddt --offline mode).
To use ddt on Piz Daint, load the modulefile:
module load craype-accel-nvidia60
module swap cudatoolkit/9.2.148_3.19-6.0.7.1_2.1__g3d9acc8
module load ddt/19.1.3-Suse-12.0

ddt -v
    Arm DDT
    Part of Arm Forge. Copyright (c) 2002-2019 Arm Limited (or its affiliates).
    All rights reserved.
    Version: 19.1.3
For further information check the documentation:
or read further:
ddt with mpi+cuda
- Install the client on your laptop
- Load the modulefiles
- Compile and link your code with cuda:
nvcc -GandCC -g - Add ddt to your jobscript
ddt --connect srun ./exe
Start the ddt client on your laptop and use it to connect to Piz Daint:
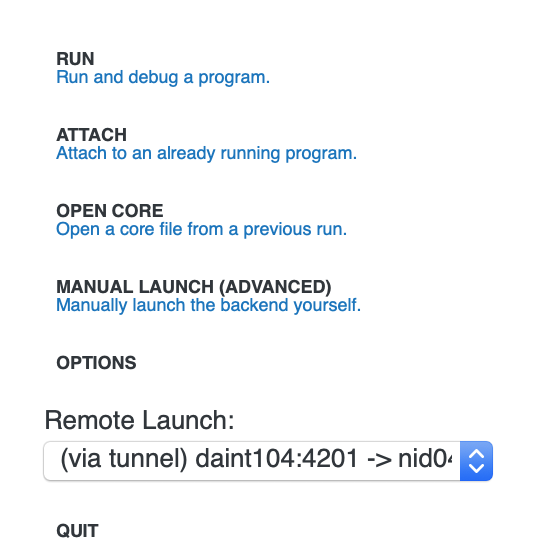
Launch the debugging session:
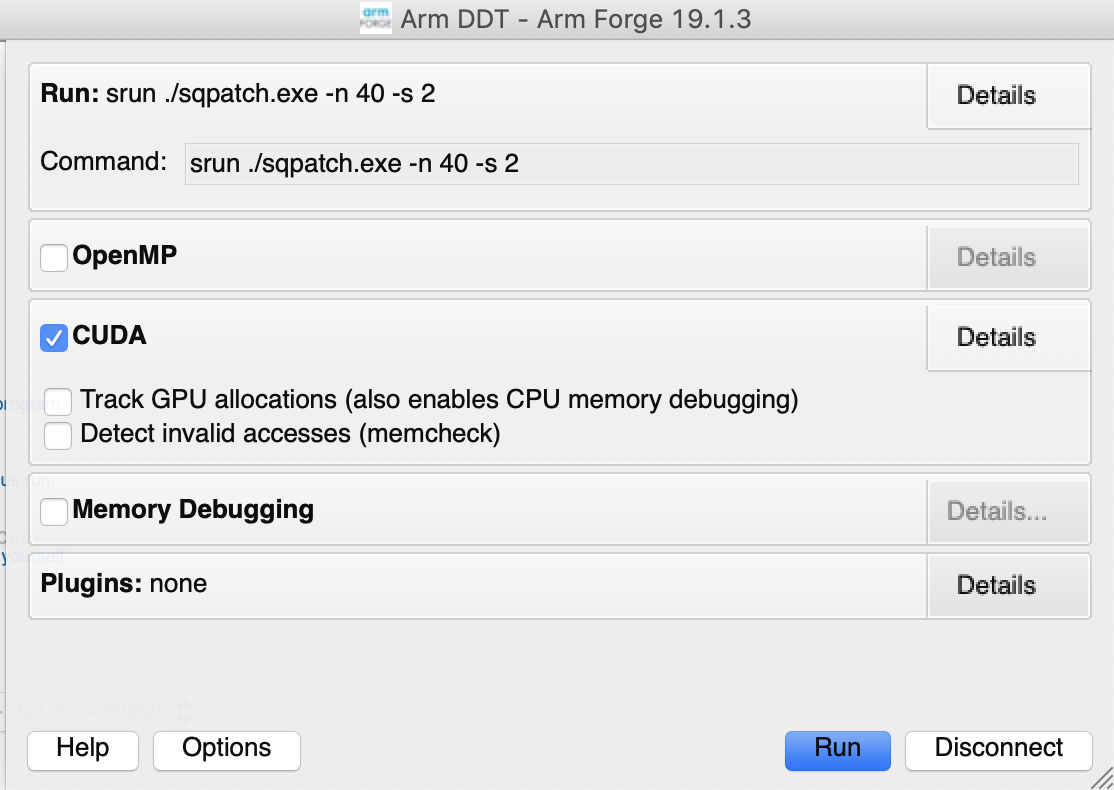
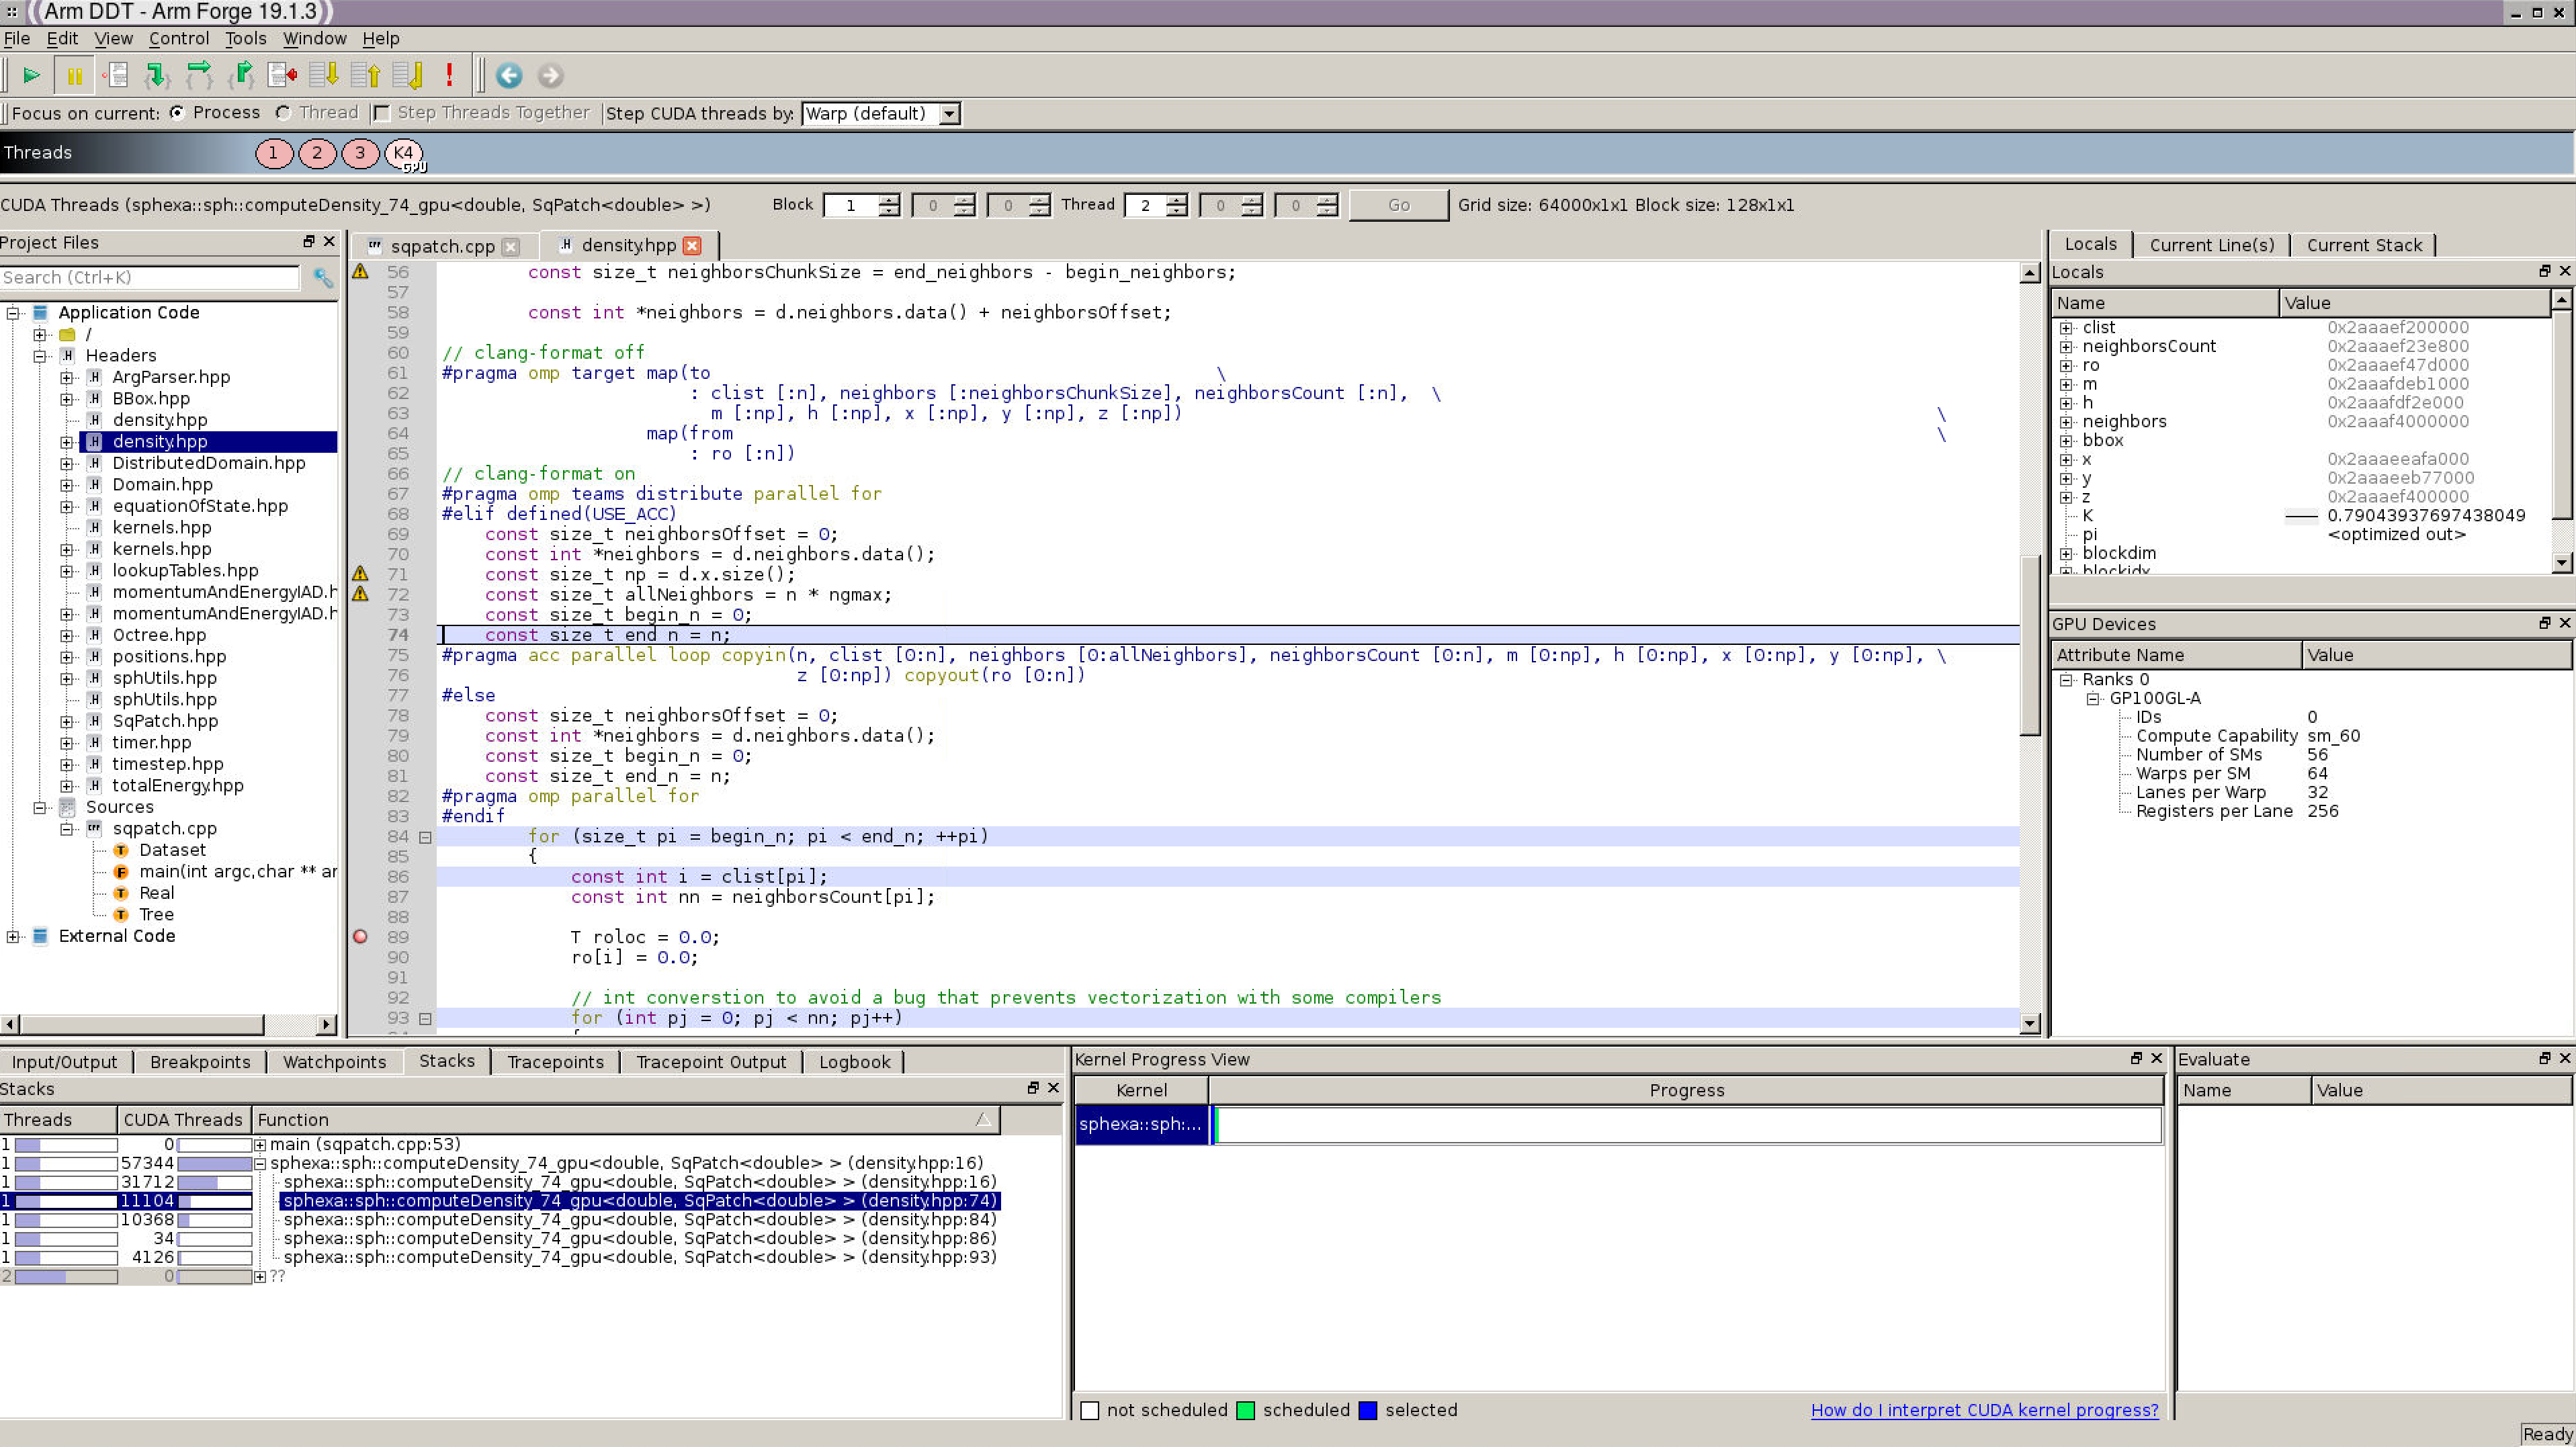
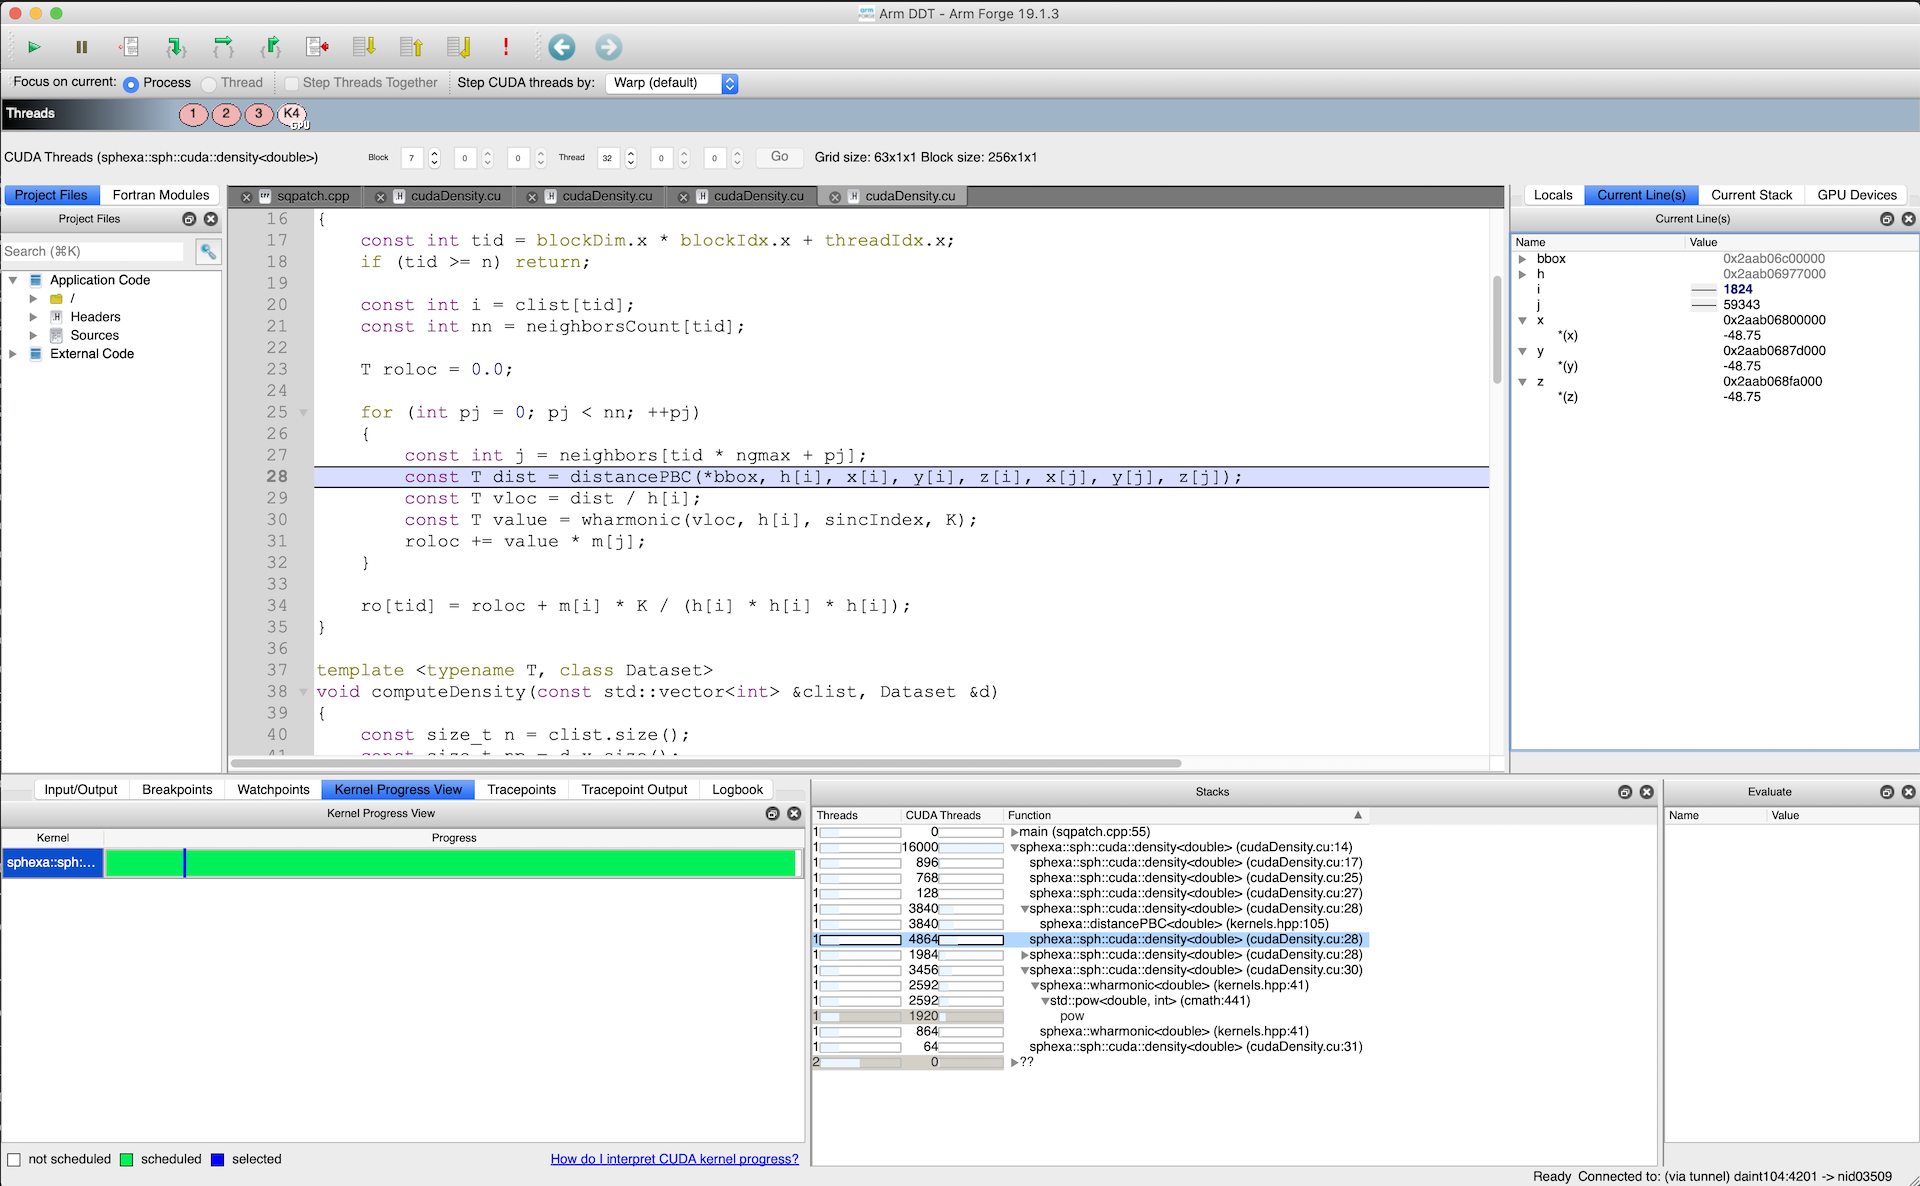
ddt will stop in the first cuda kernel reached:
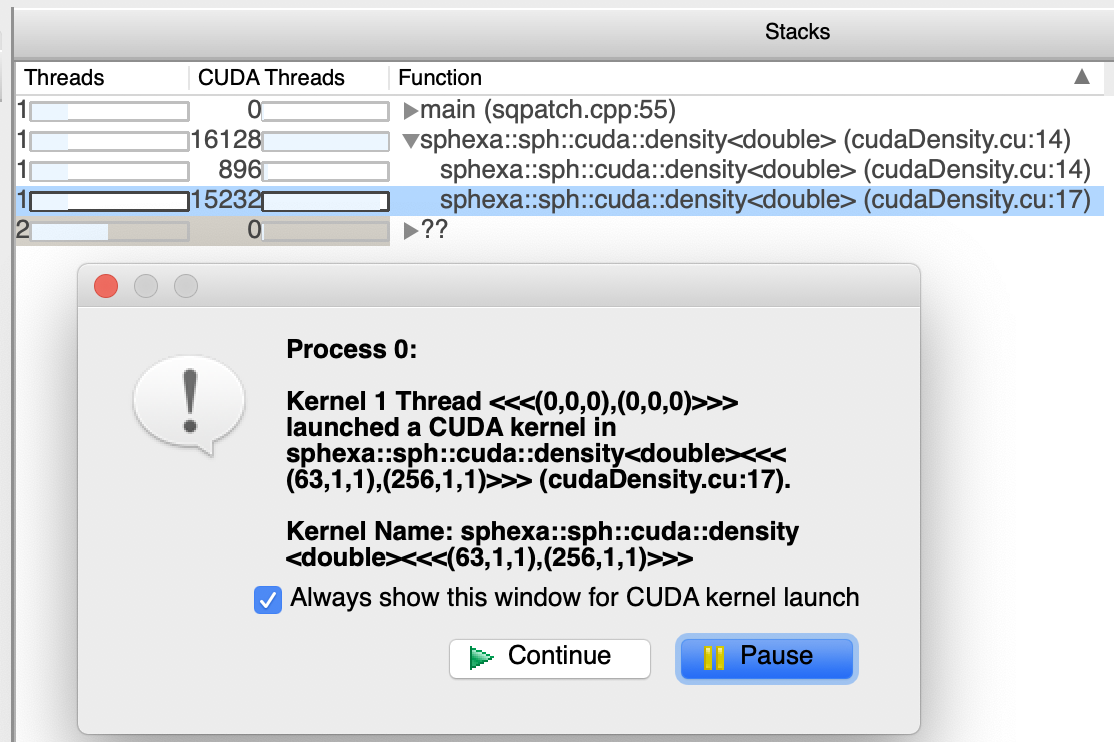
start debugging your cuda code:
ddt with mpi+openacc
- Install the client on your laptop
- Load the modulefiles
module load daint-gpu
module unload PrgEnv-cray
module load PrgEnv-pgi
module load craype-accel-nvidia60
module load ddt/19.1.3-Suse-12.0
module unload cudatoolkit
module load cudatoolkit/9.2.148_3.19-6.0.7.1_2.1__g3d9acc8
export CRAYPE_LINK_TYPE=dynamic
export OMP_NUM_THREADS=1
export ALLINEA_FORCE_CUDA_VERSION=9.2
export PATH=/opt/cray/pe/cce/8.7.3/binutils/x86_64/bin:$PATH

CC -std=c++14 -g -O1 -acc -ta=tesla:cc60,debug sqpatch.cpp
- Compile and link your code with cuda:
CC -g - Add ddt to your jobscript
ddt --connect srun ./exe