Proposal
The Laser Games: https://store.steampowered.com/app/3152120/The_Laser_Games/
An important aspect of the game is communicating player statistics to users. Currently, there are only basic visuals, mainly tables, to show the results of the player. An additional in-map visual was developed last semester to show player positional data, visualizing data in 3D space, for the other visualization class.
This project proposes some UI visualization to show player generated data in The Laser Games. There is no set type of visualization yet for what the visualization will look like. Depending on the requirements of the class project, the visualization could either consist of multiple different small visualizations to showcase different aspects of the player's statistics over their play career and/or over a match; or, a detailed visualization to emphasize specific aspects of the player.
An optional requirement for this project, regarding utilization with The Laser Games, is to make a modular system able to be re-adapted to different Unreal Engine games and even projects beyond UE. Regarding tasks, the team behind The Laser Games will likely concern with the API with the engine and game, while the classmates would focus on developing the visuals themselves.
The following data is/can be provided to the visuals:
- per game (able to be saved per match, or shown at the end of a match)
- hit info (list)
- target
- hit spot (front/back, weapon, etc.)
- points
- distance
- start, end location
- multiplier (num bounces)
- time of hit
- total shots
- total distance
- additional stats may be exposed depending on the requirements of the visualization
- hit info (list)
- player global
- customizations (able to be changed at will by the player)
- color
- name
- handedness
- 1st/3rd person
- additional future items able to be unlocked
- global num shots, hits
- num matches played
- total distance
- customizations (able to be changed at will by the player)
Data is collected from in-game stats, and potentially via the Steam API for global player stats.
Data processing is a component of the objectives of the project, essentially developing an API to transfer data to the visualization medium. A simple data storage technique such as XML or JSON should function ideally, being simple enough to implement and utilize. Data being stored would consist mostly of numeric values, perhaps indexed by time or by multiple elements (such as multiple hits). Some string values might be used to identify players or as static data, such as chat messages.
- Develop a UI visualization framework for The Laser Games, allowing for dynamic visualizations of various game data in a
user-friendly manner
- Identify ideal statistics to demonstrate the visualizations for the class project
- Implement the visual in a way such that it can be loaded on a website
- Implement an API between the game and the visualization website, to allow for the dynamic data to be recorded and transferred
- Implement in a manner which abstracts the API functionality away from dependency on the specific game, allowing it to be applied to other projects without redesigning the API
- visualization(s) for in-game data
- simple web interface to switch between different visualizations
- API to export data into a format able to be understood by visualization website
-
- technique to transfer data from game to visualization
-
- abstracted API to allow for reimplementation
- interactive visualizations able to show additional data from mouse, keyboard inputs
- showcasing the visualization interface in-game (or during gameplay, i.e. through the Steam UI)
- Data collection policies as needed, if uploading game data to a server is warranted
Schedule will be reflected into Github issues as tasks, for project management. A project board is available for viewing here. Planned schedule is ideal, and based on factors outside the control of the developer, like other classwork.
- Planning: identify planned visualizations
- refine current design examples (below)
- Create initial UE plugin
- 1-2 weeks, after discussion with TAs
- Data extraction
- Update in-game data systems to collect additional data as needed
- Implement serialization of data into text format
- 2-3 weeks
- Visualizations initial draft
- Implement web-side data processing/upload
- Develop proof-of-concept test visuals
- 1-3 weeks
- Visualizations, API refinement
- Optimize data collection and exporting if necessary
- Improve initial visuals
- Develop new visuals based on the structuring from the initial visuals
- 2-4 weeks
- Refinement, publishing setup
- Implement interactions into visuals
- Final draft of visuals for class project
- Update wiki for API documentation
- 2-4+ weeks, work may continue past class deadline
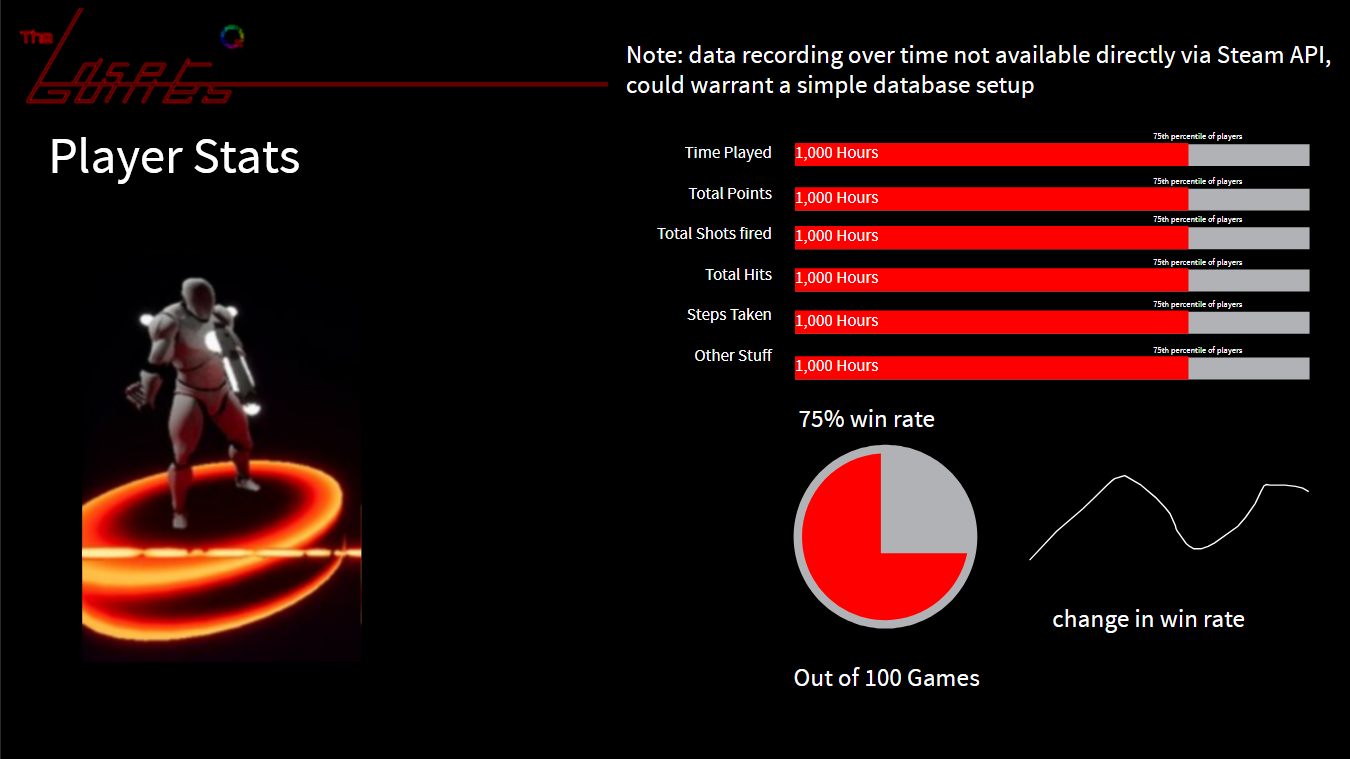
This visual page should show a player's stats over all their games. It can include various stats for the player, like number of games played and total points earned. It can be presented in a way which allows the player to compare how they do against the rest of the playerbase. Some features related to match-specific trends over time might require an additional database to record the data for, and as such may not be viable in the scope of the class project.
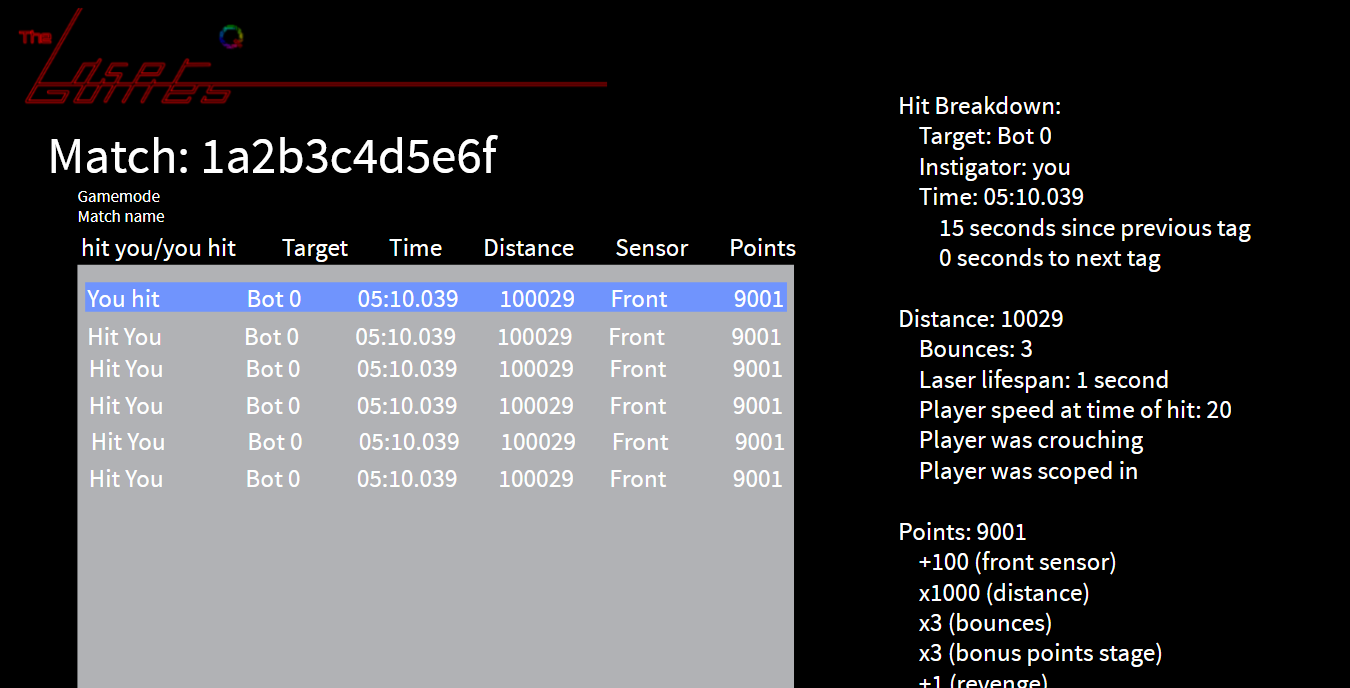
This visualization is intended to mimic real-life laser tag scorecards, showing a list of hits for the player as well as some stats in the match. It is in a text format, but can have some graphs and additional visuals to enhance the stats shown.
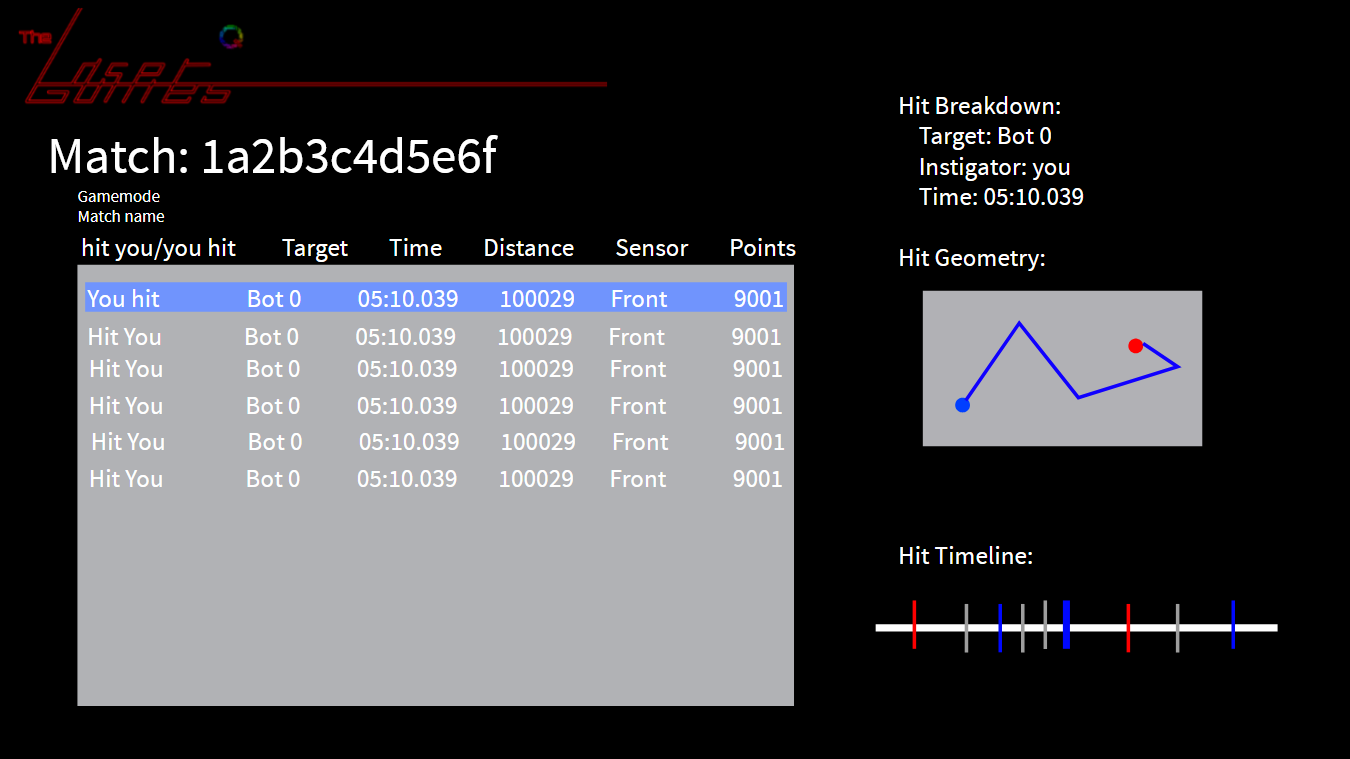
This is an example of the player selecting a hit and seeing more information about said hit. The hit geometry would require tracking positions of lasers in a given hit, but could be a cool visual to see how a player tagged another player. The match timeline is a condensed form of the global match timeline, intended to show events around the given tag time, including adjacent hits and tags by the player, and in grey, events not involving the player.
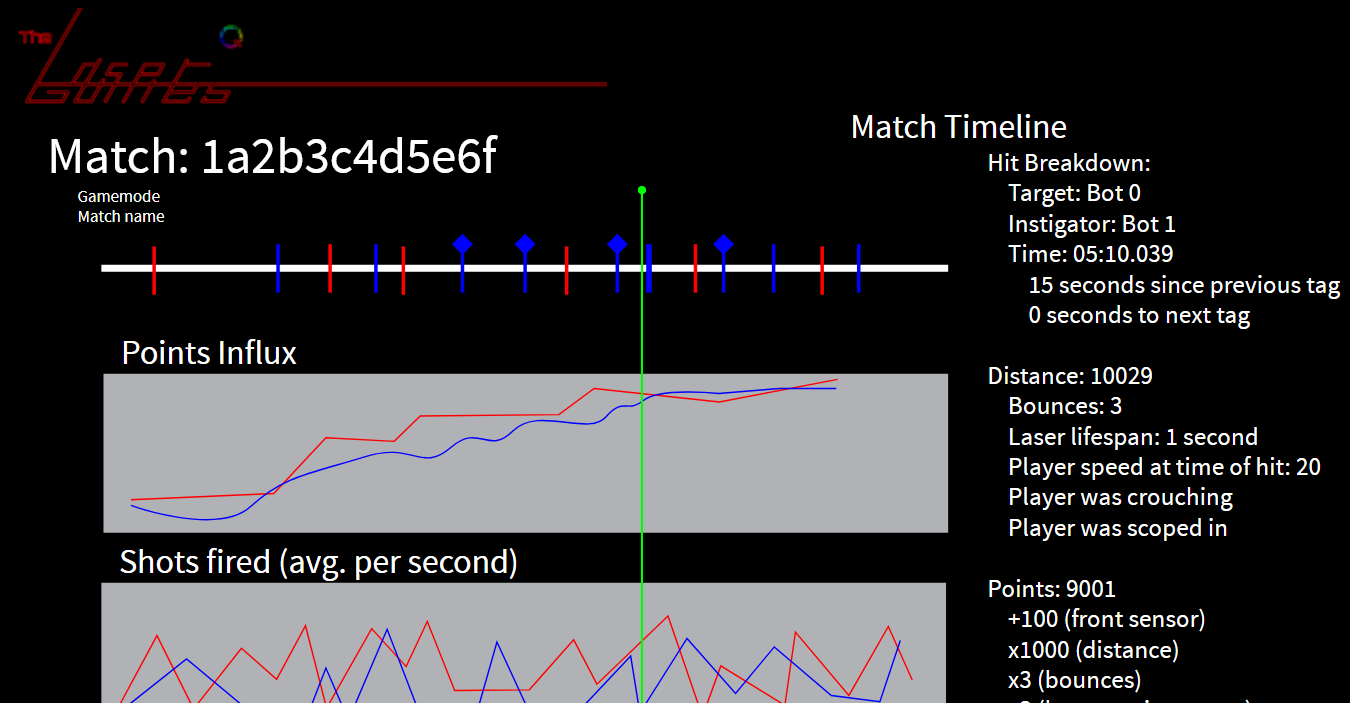
The match timeline shows all the events that occurred over the course of a match, with accompanying graphs showing various trends over time. Upon selecting an event, the user can see data about that event similar to the player scoreboard selection, except this shows data not specific for the player. Colors can be used to differentiate between players / teams.
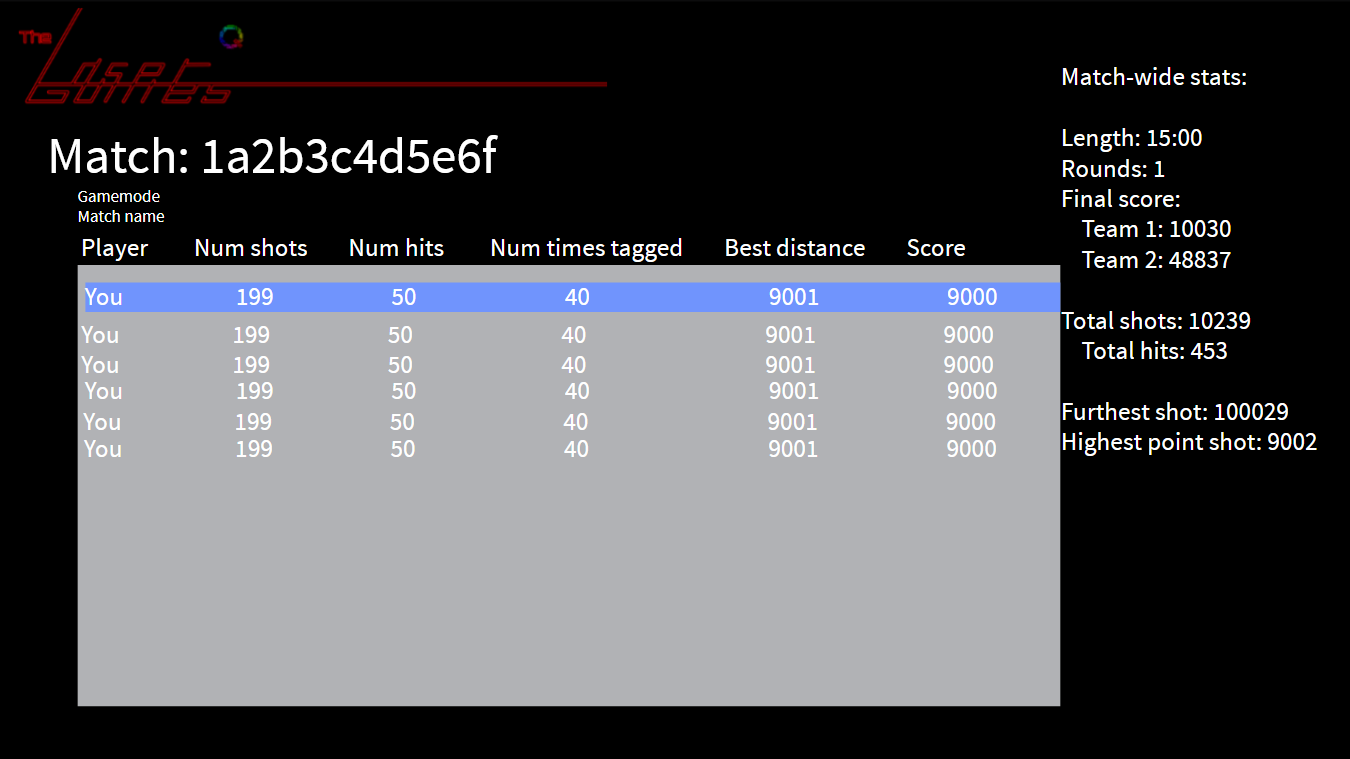
The match leaderboard would show an overall leaderboard of all players in a match. This leaderboard is able to be sorted by the various attributes shown, and mimics the leaderboard accessible during gameplay. Stats and visualizations to the right of the leaderboard can be added to give data for the whole match.