Outputs
Connect to MLflow:
mlflow ui -p 5000
Open internet browser on the following address:http://localhost:5000/
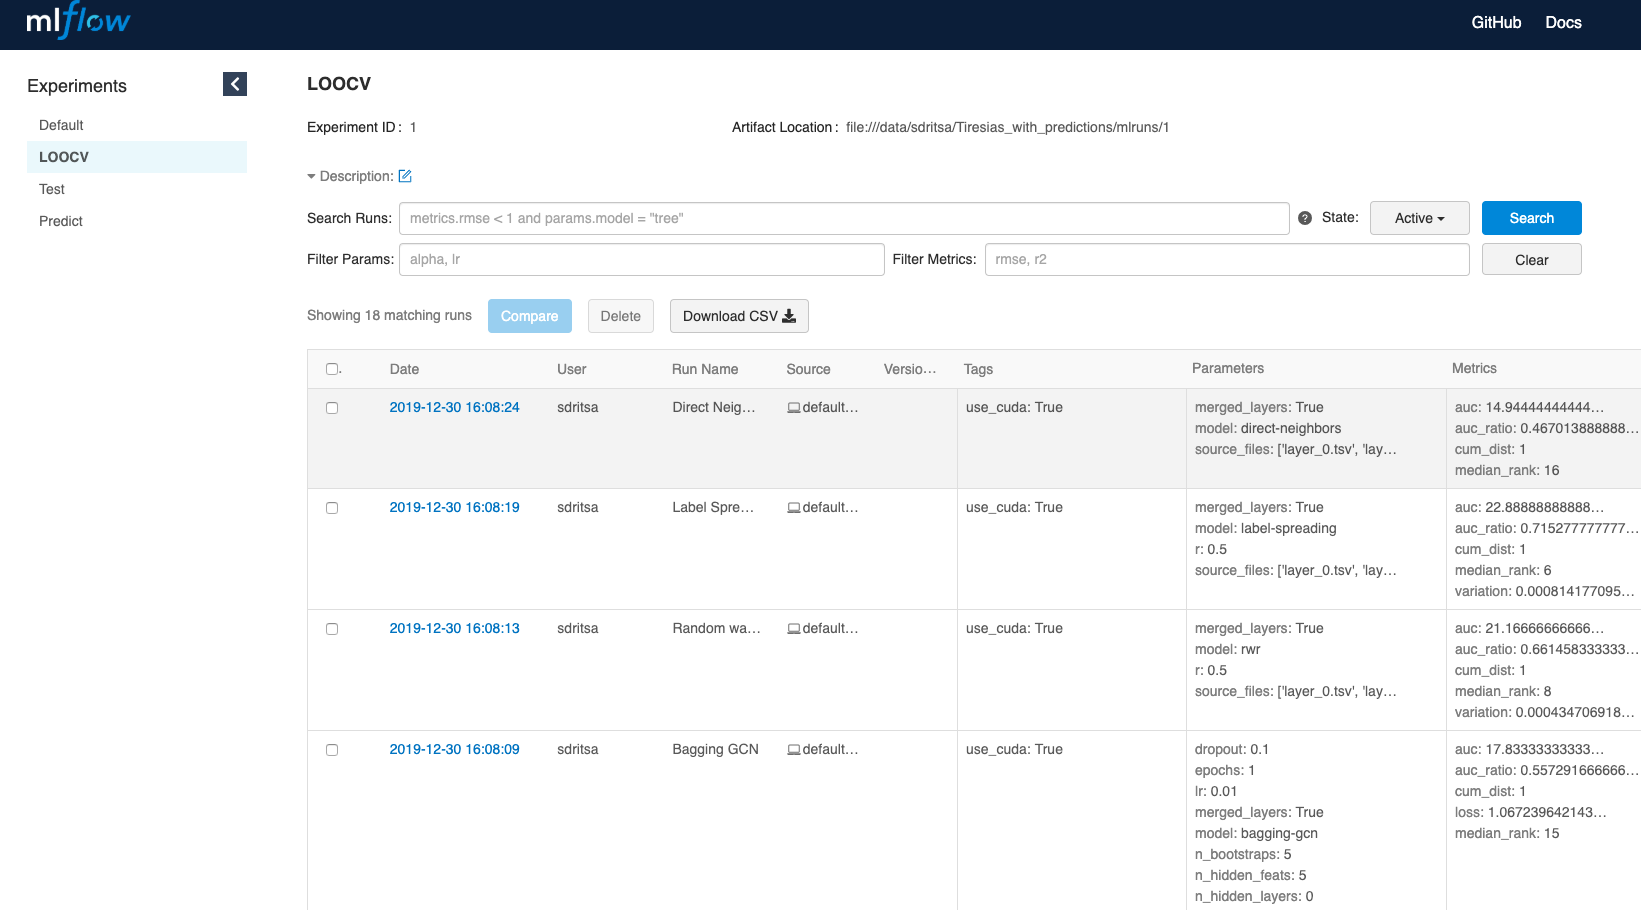
First MLflow window opening shows the models run:
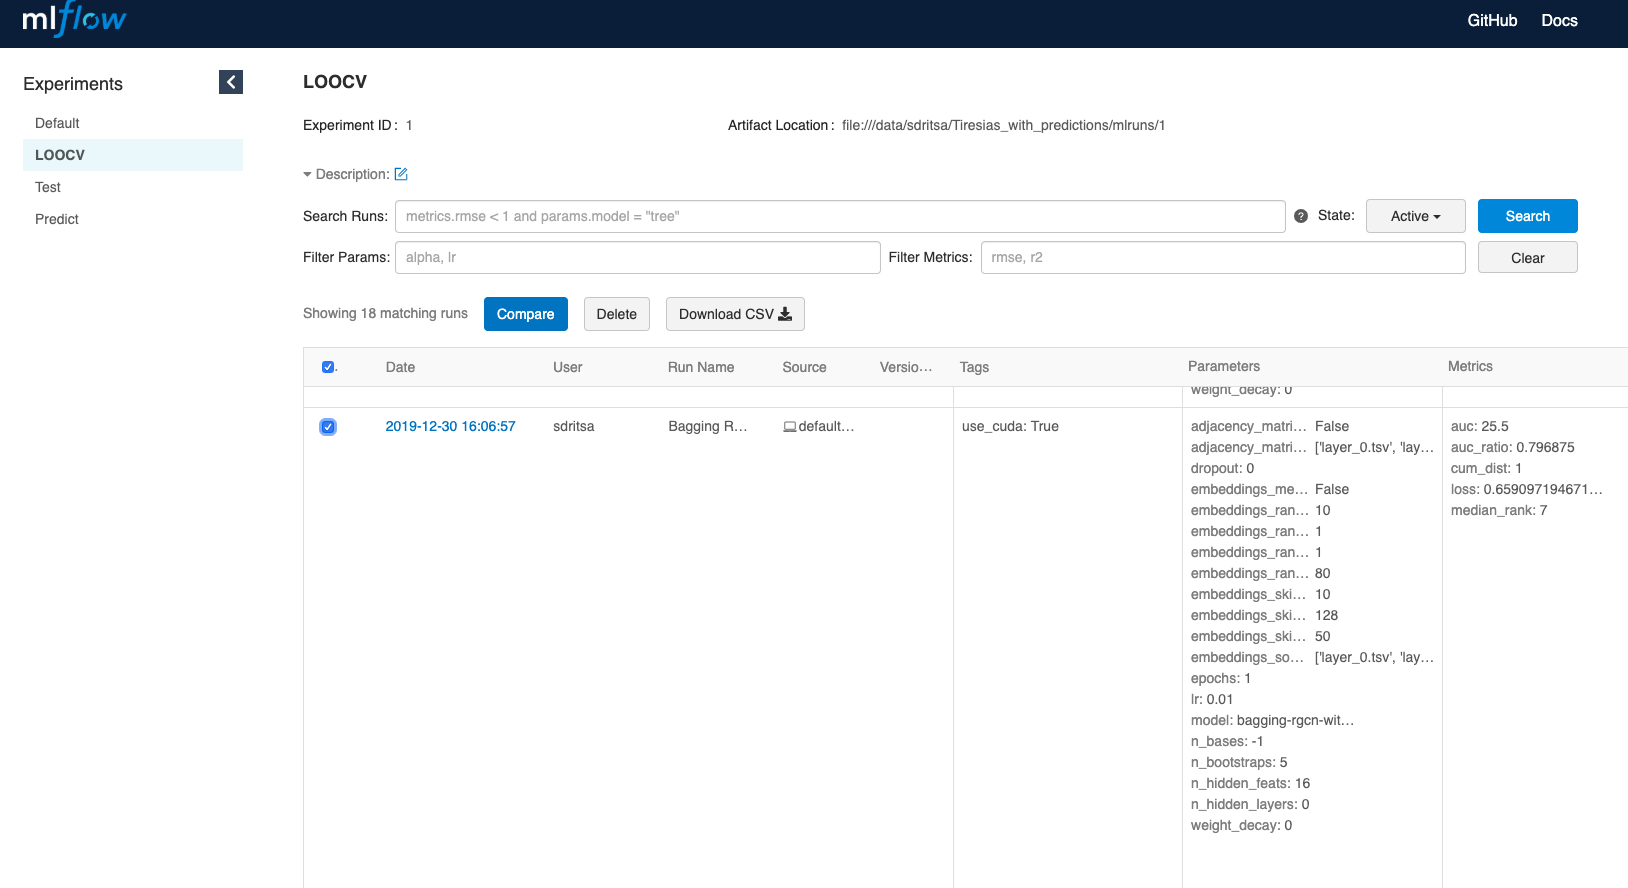
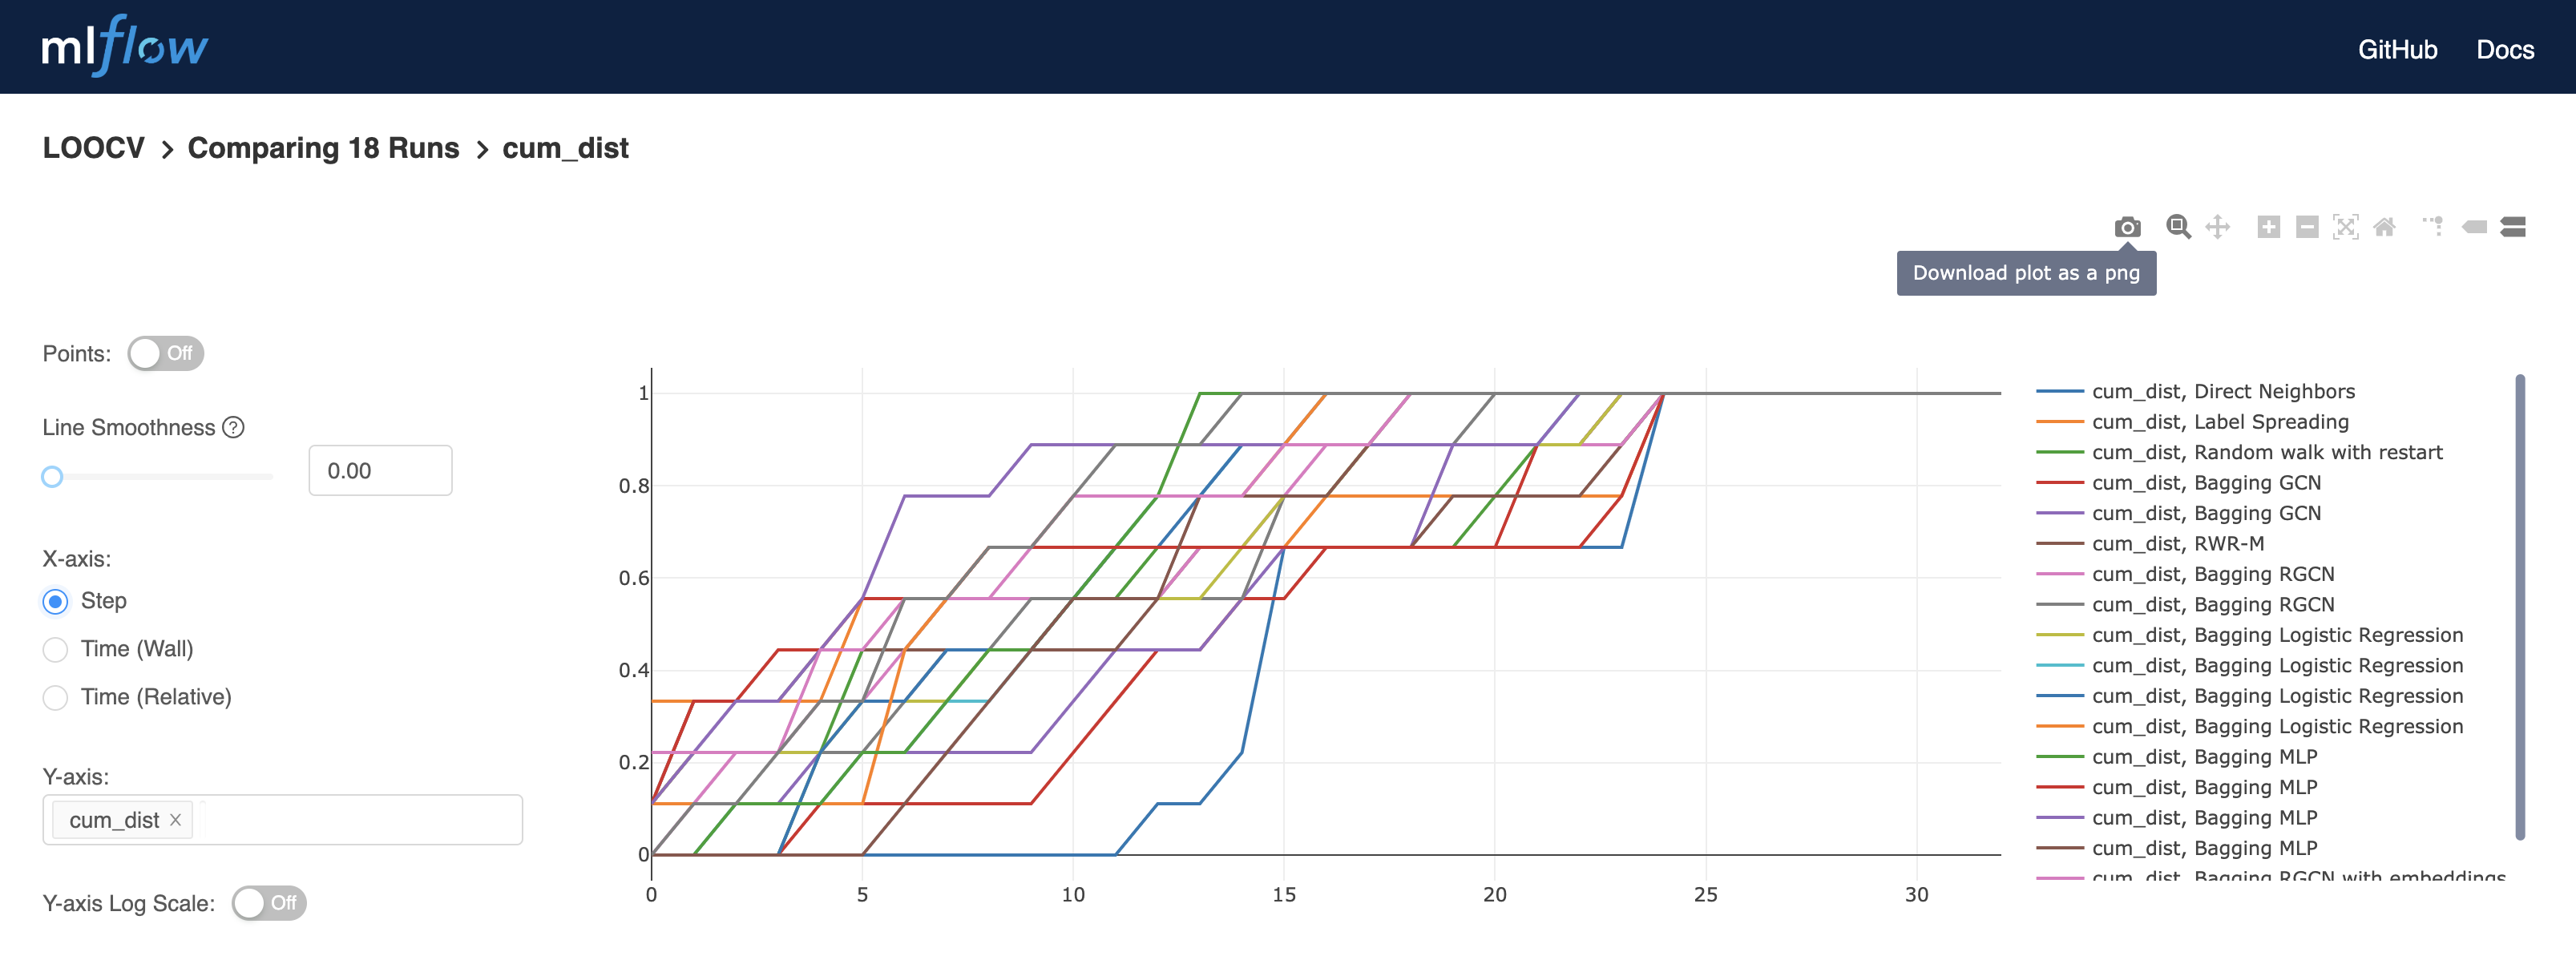
To visualize the cumulative distribution curve, select the relevant models and click on compare:
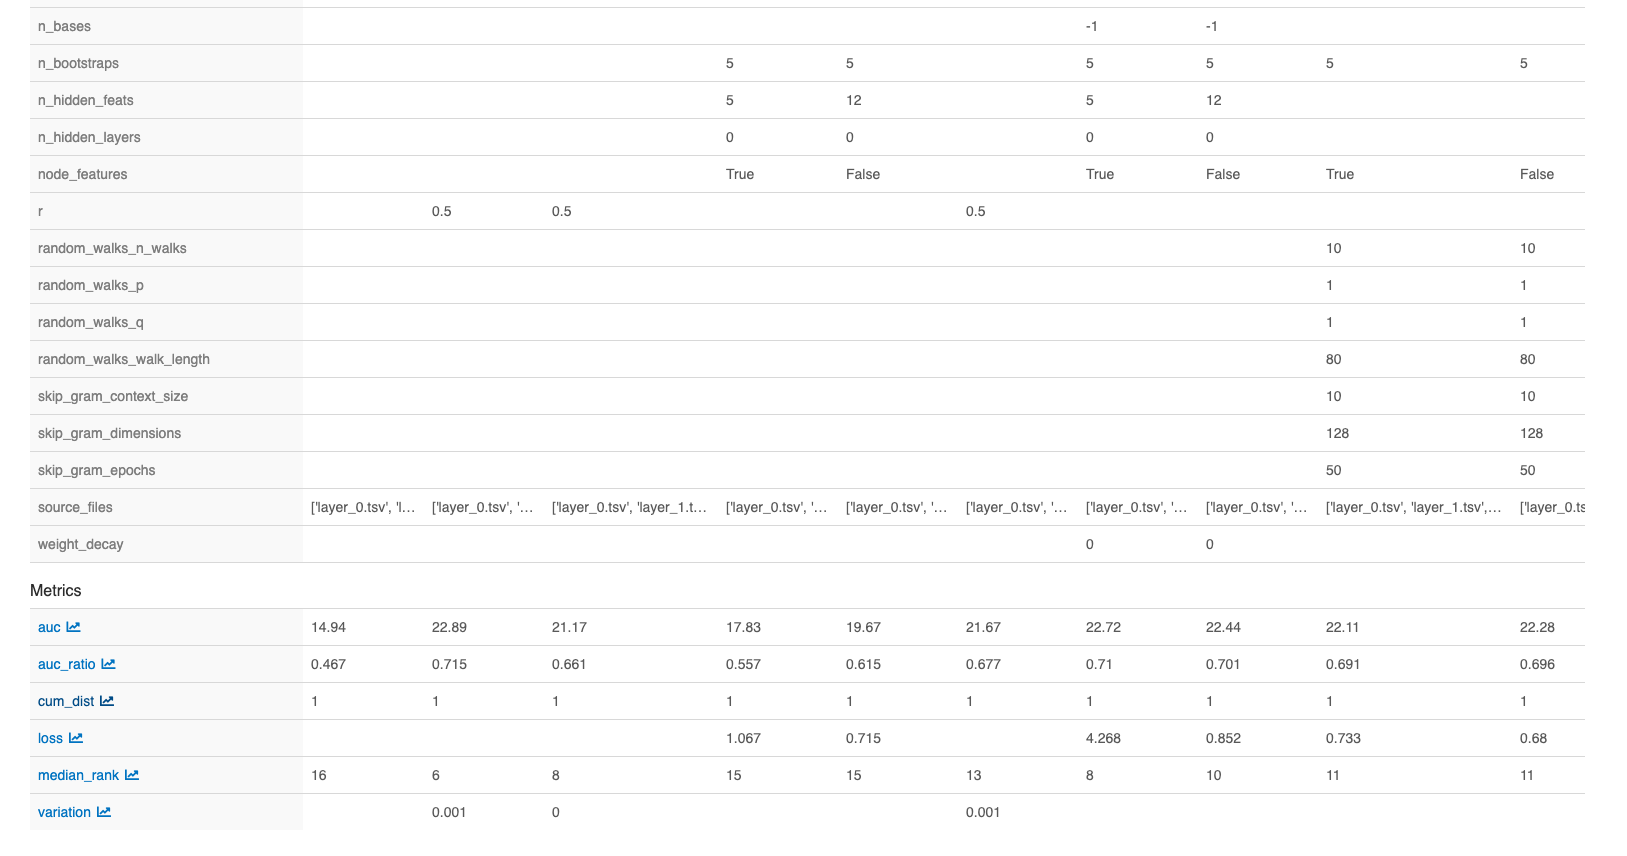
On the bottom left of the opening page, click on cum_dist:
Click on step from the choices on the left for a visualization of all protein coding genes on the x axis:
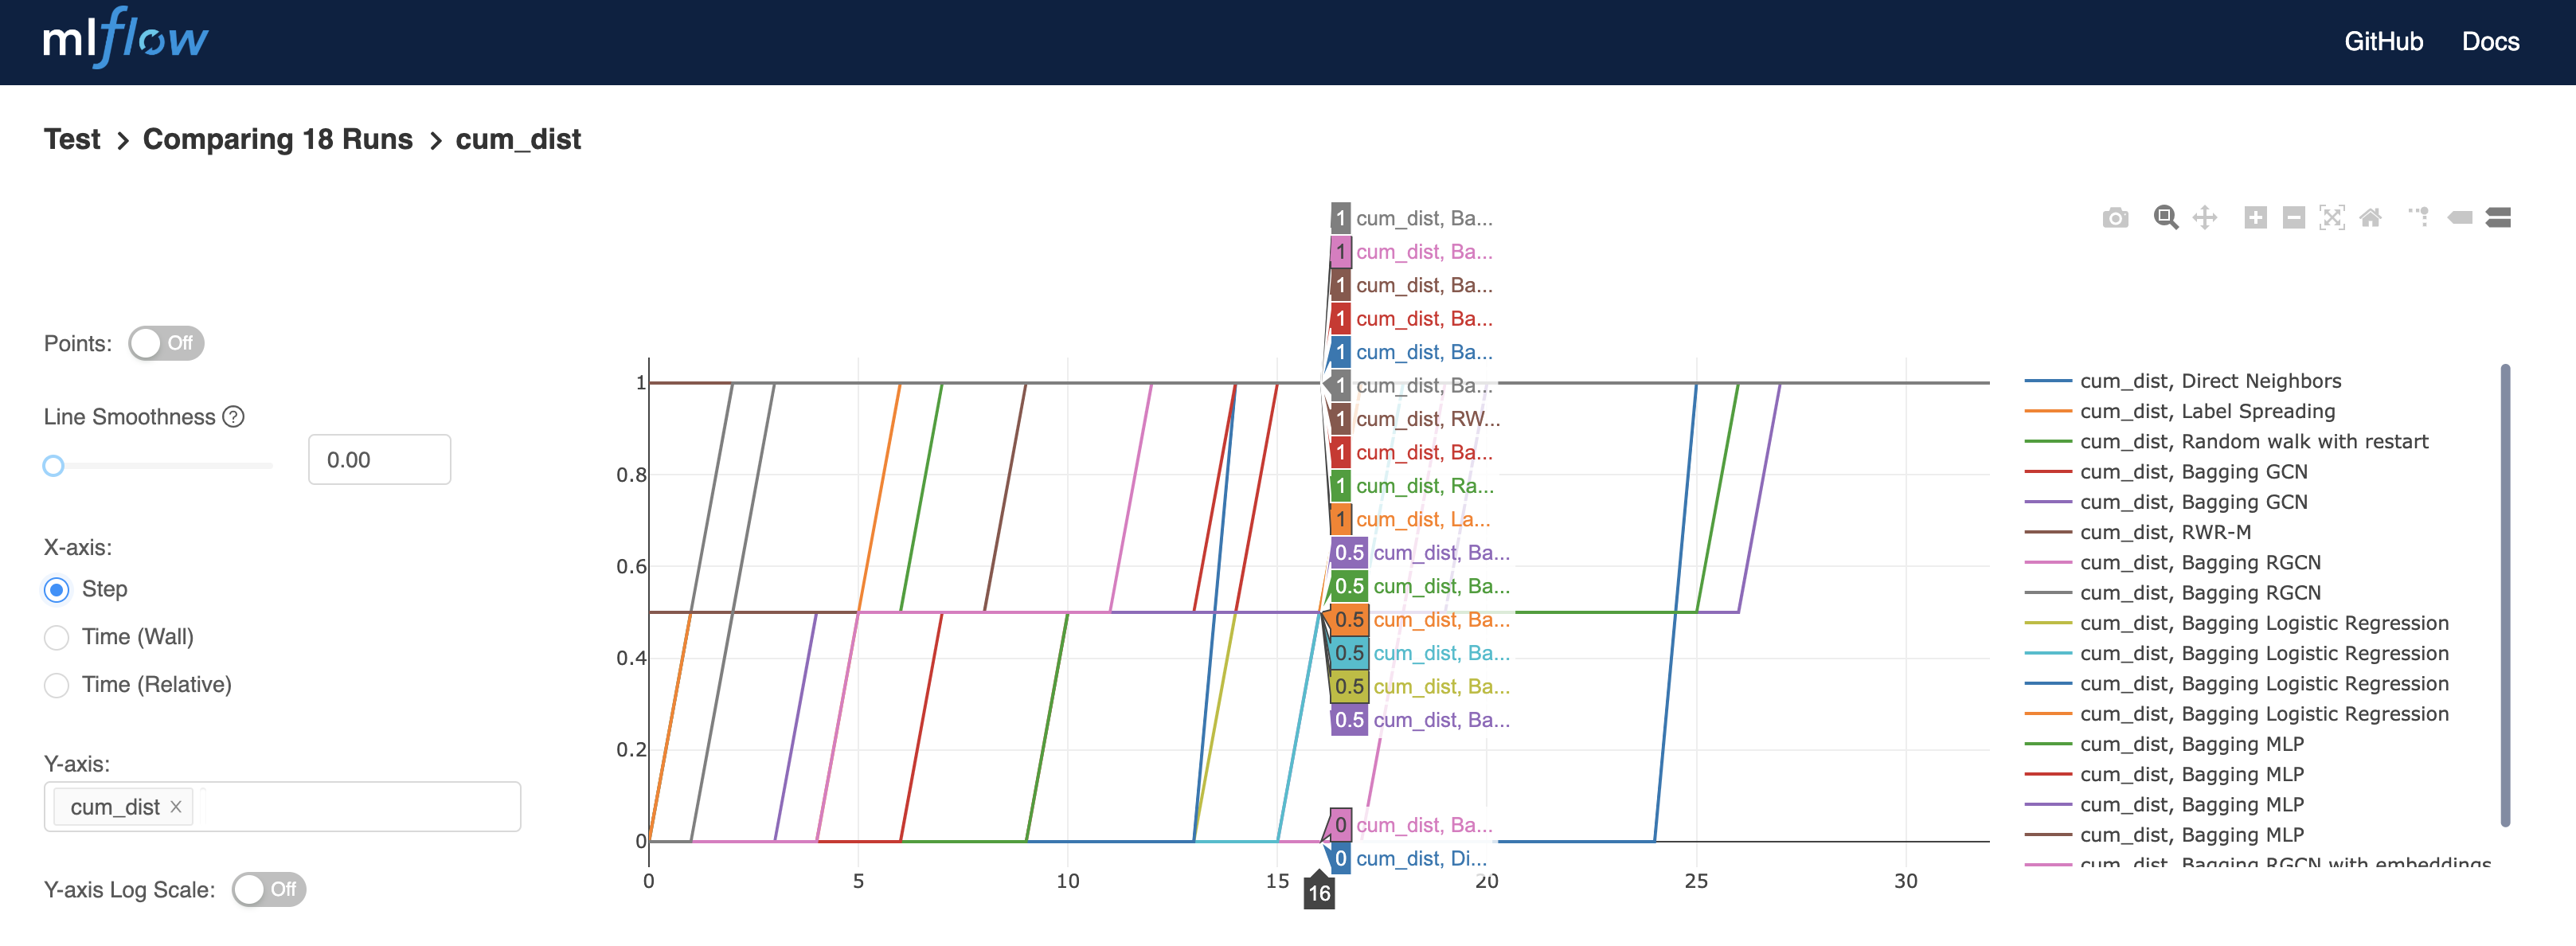
Plots can be downloaded, and more information is revealed by placing the pointer on the curves, such as the percentage of known disease genes found in the first 16 predictions:
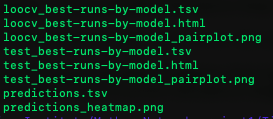
Model performances based on the AUC of the cumulative curve, with all the run parameters per model can be found in files “loocv_best-runs-by-model” for LOOCV results and in files “test_best-runs-by-model” for the test run results.
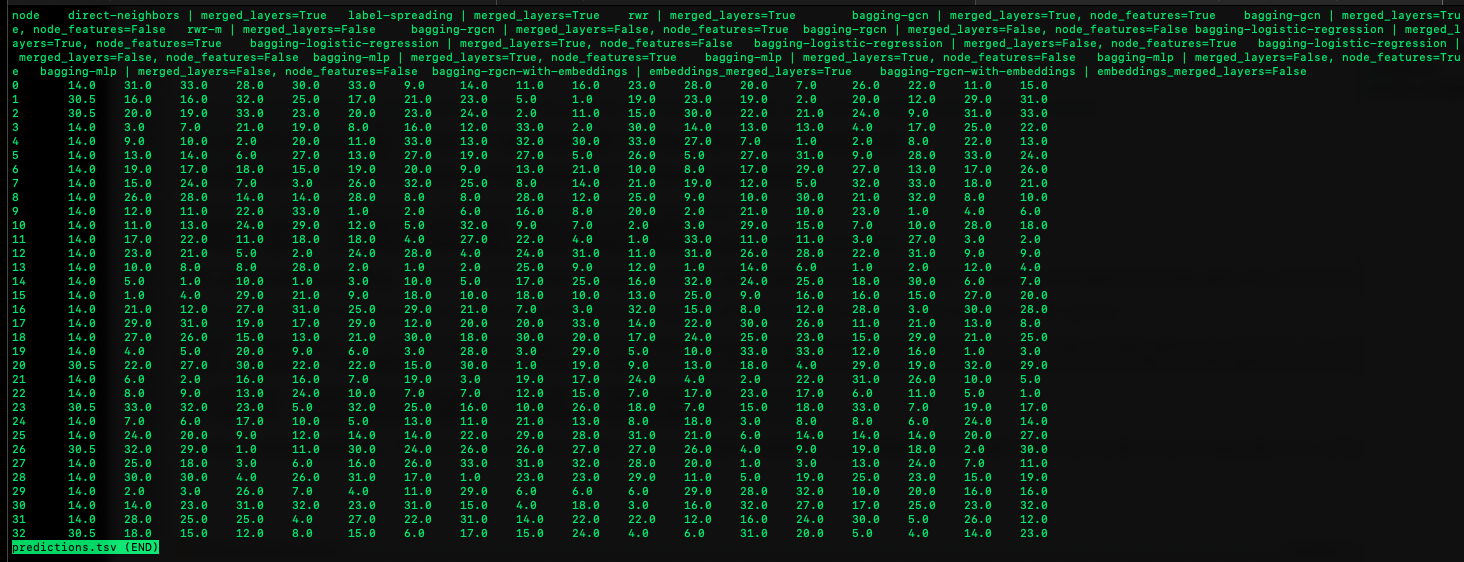
Ranking results of the LOOCV of the unlabeled genes can be found in the file “predictions”.
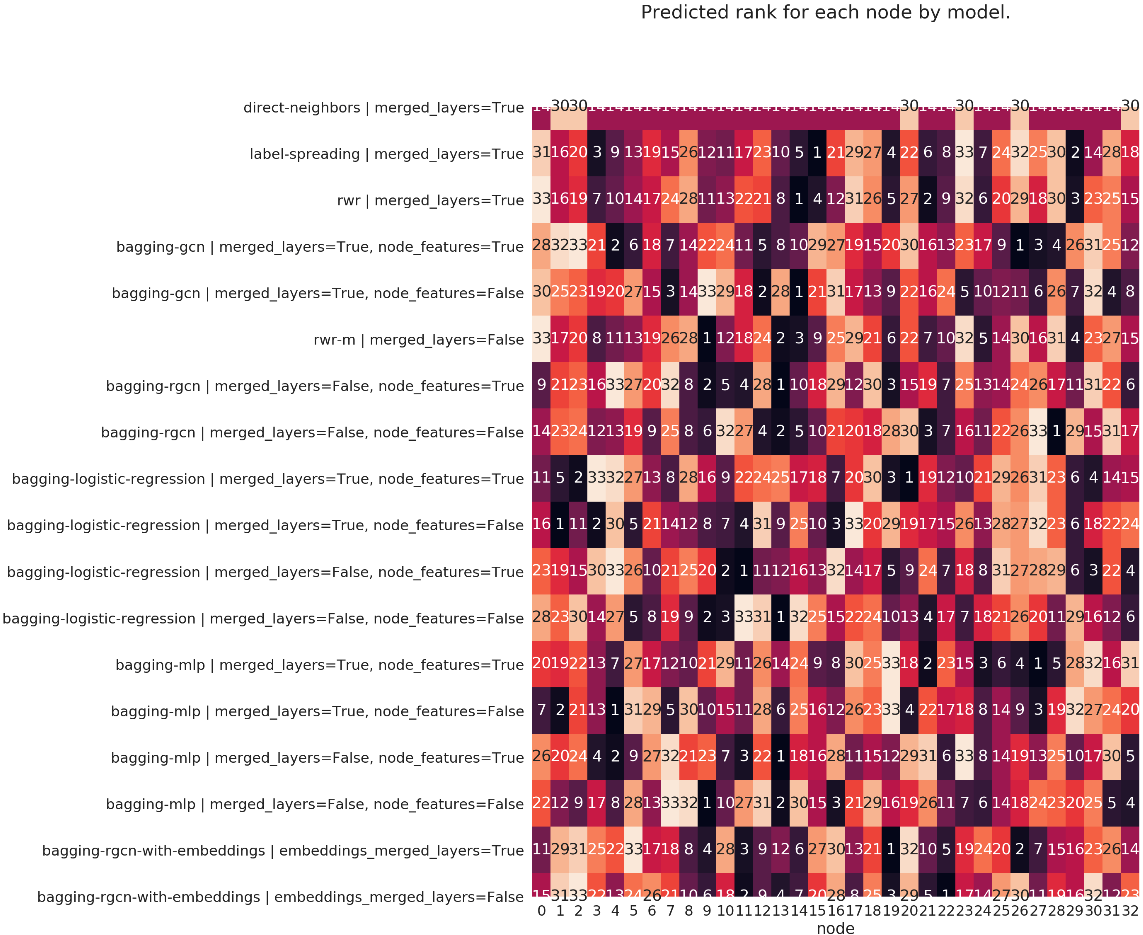
The predictions of each model on each node is presented in a heatmap:
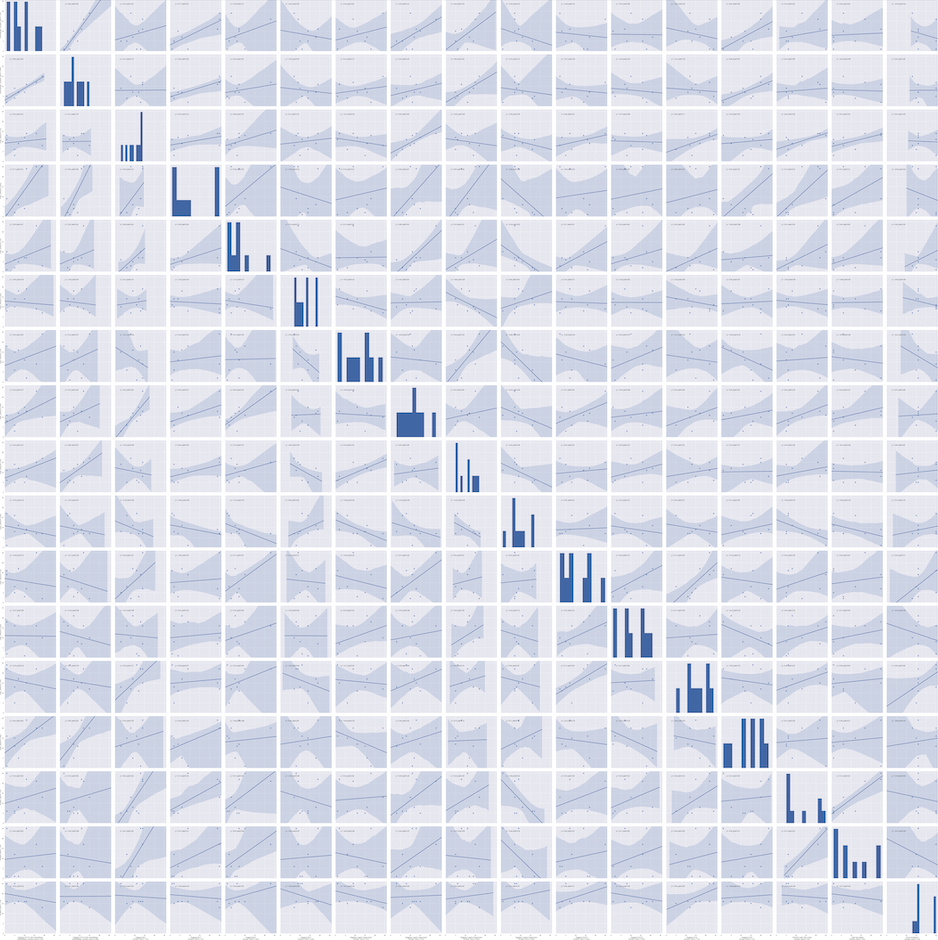
Results for the statistical pairwise metrics can be found in figure format in the files “loocv_best-runs-by-model_pairplot.png” or “test_best-runs-by-model_pairplot.png”.