Visualisation
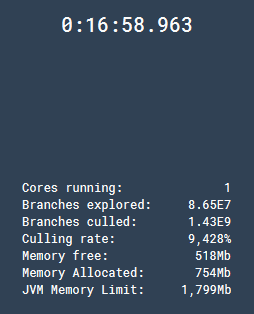
The visualizer for Ainur can be viewed with use of command line optional argument -v. This will display a window holding various data about the algorithm run time. Because the algorithm can sometimes run very fast, it is noted that the visualization works best when running on a lengthier problem. The window can, however, be useful for visualizing statistics like time take, search space culled, nodes most often visited, etc. A more comprehensive discussion of these can be found below.
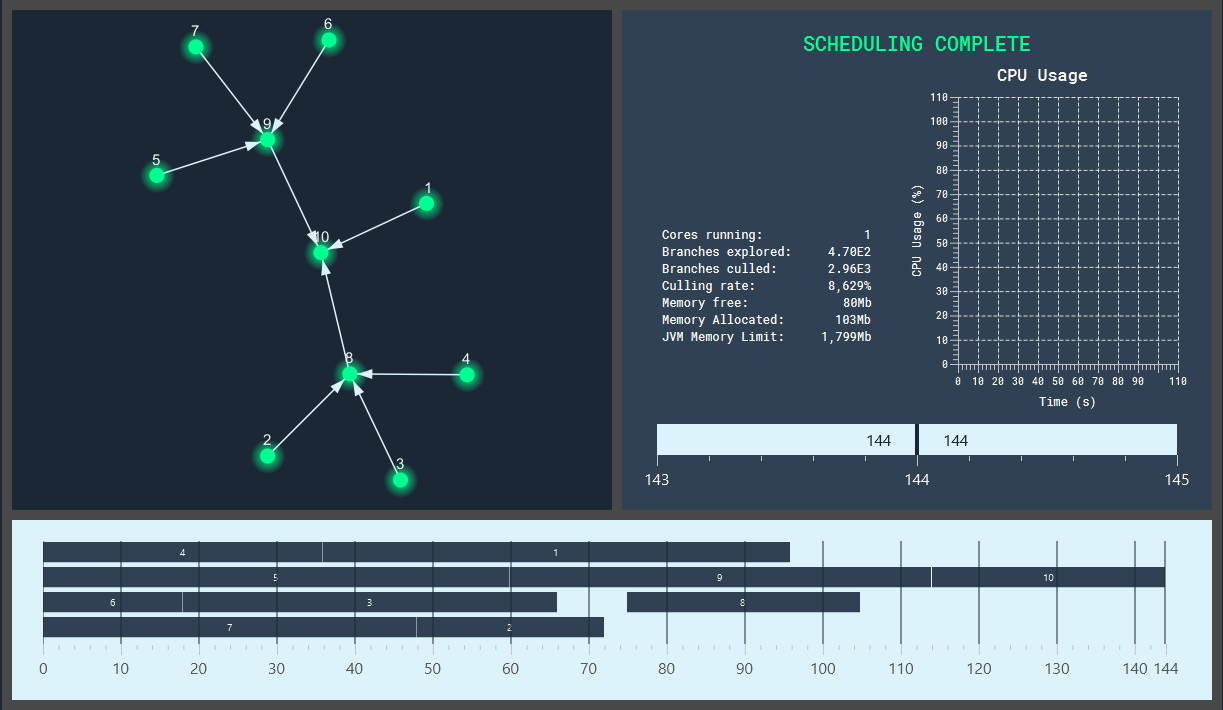
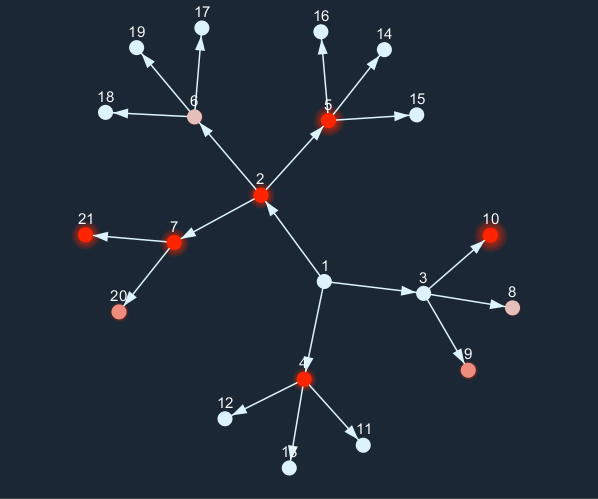
| In the upper left corner of the window is a graph representing the input problem space. As the algorithm searched through partial schedules branching off certain nodes their corresponding image will light up on the visualization! The graph will show the most visited nodes from the past second with a proportional glow intensity. Individual nodes can be dragged around the window and the shape of the graph can be manipulated as the user prefers. |
|
|
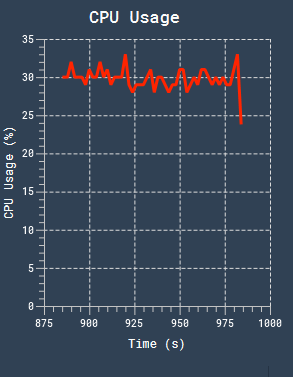
In the top right of the visualization there is a line-graph displaying the last 100 seconds of CPU usage. The chart updates approximately every 2 seconds. In particularly fast instances the graph may not have time to poll the Operating System, and the chart will remain blank. |
|
|
|
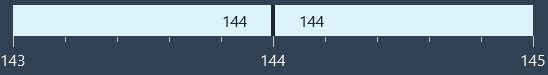
The long loading-bar looking thing fond below the CPU usage chart and miscellaneous statistics is the Bounding Schedule Time Graph. It works by indicating the algorithm's current upper and lower bounds that it knows the answer *can't* be on either side of. As the program progresses, you should see this bar close in on a tighter and tighter range of possible values as the algorithm is able to rule out certain ranges. When the algorithm terminates and an optimal solution is found a finishing indicator mark will appear on the optimal value that the algorithm calculated. |
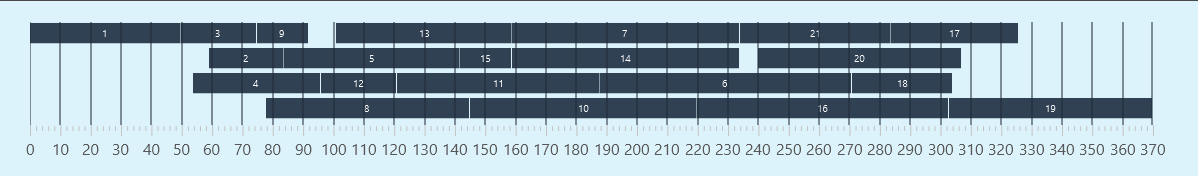
| Along the bottom of the visualization is a Gantt chart representing the current best schedule that the algorithm knows of. The chart will refresh every 2 seconds. Note that because the best schedule length only every decreases, the axis along the bottom will re-scale. |
|
When your job completes, all nodes will light up green and the optimal schedule will be displayed at the bottom!
Note: The program will not exit on closure of the window. i.e. The algorithm will continue even if the visualisation window is closed.