RemoteLab is a platform intended to be run on small SBC like Raspberry Pi providing remote access to development boards like STM32 boards.
The project is developed in Python. Initially, the web server providing services like status server and camera server was realized using Flask.However, current implementation depends on Django unifying these two services and enhancing user experience.
I have created this platform for my students at Wrocław University of Science and Technology. During the period of pandemic it was necessary to develop a tool which would enable students to remotely realize exercise as they would do during normal classes. The initial version was launched in 2020 and since then it is operational 24/7 providing access to remote resources.
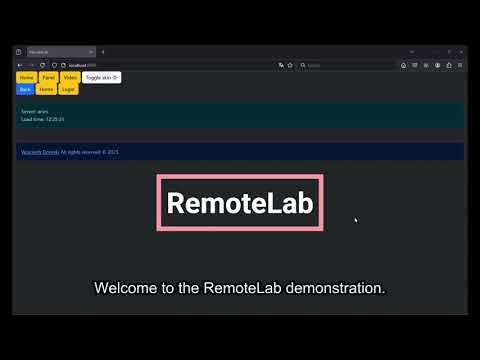
Demonstration of the RemoteLab is available in the below video:
Also, there are articles featuring the RemoteLab platform:
- RemoteLab - a distributed Hardware-as-a-Service platform
- RemoteLab goes open source
- RemoteLab can now plot data in real-time
First create a virtual environment
python3 -m venv --system-site-packages .venv
Activate virtual environment
source .venv/bin/activate
Run upgrades and installation of necessary packages
pip install --upgrade pip
pip install -r requirements.txt
Run migrations for Django
cd RemoteLab
python manage.py makemigrations
python manage.py migrate
Before starting the file there are two mandatory changes that need to be done in the source code.
Inside RemoteLab/boards/views.py at line 16 there is:
boards_config = "/home/pi/mcu-remote-work-pwr/resources/boards.json"
You must replace it with path to specific file with boards definitions. An example is available at RemoteLab/resources/boards.json.
Inside RemoteLab/home/views.py at line 14 there is:
config_file = "/home/pi/mcu-remote-work-pwr/resources/config.yml"
You must replace it with path to specific file with boards definitions. An example is available at RemoteLab/resources/config.yml. This file also points to boards.json. In future it will be unified and configuration will be done outside of the project.
To configure debugger services for each type of board, you need to edit the RemoteLab/resources/debugger_config.yml.
Now, you can run Django server, e.g. using build-in HTTP server
python manage.py runserver 0.0.0.0:8000
Attention! One additional change is required. Since the RemoteLab platform is based on Django you need to provide a secret key. A sample secret key is provided, however it is highly recommend to change it.
The key is a text string located in RemoteLab/RemoteLab/settings.py file. It is located at line 23. Current value is:
SECRET_KEY = 'django-insecure-qg5v2u@v0^68gnd%&n3-!avv#((*@#icm43$)kj5x$0-ro7hwc'
RemoteLab configuration is done following files:
- config.yml: basic configuration of the RemoteLab platform, it points to other configuration files,
- servers.json: configuration of each RemoteLab server,
- boards.json: configuration of each development board provided by RemoteLab,
- debugger_config.yml: configuration of each debugger service.
The onfiguration file determines the basic configuration of the RemoteLab platform. It is a YAML file containing the following keys:
- boards_config: path to the boards.json file,
- debugger_config: path to the debugger_config.yml file,
- servers_config: path to the servers.json file,
- password: MD5 hash of the super user password,
- camera: configuration of the camera used for video streaming. It contains the following keys:
- resolution: resolution of the camera in format width x height,
- jpeg_quality: quality of the JPEG image, from 0 to 100. 0 means compression disabled.
- debug_proxy: configuration of the debug port forwarding feature. It contains the following keys:
- status: status of the feature, can be either enabled or disabled,
- ssh_user: SSH user used for connection,
- ssh_key_path: path to private SSH key used for connection.
- notes: configuration of the notes feature. It contains the following key:
- file_path: path to HTML file containing notes to be displayed in the web interface under Notes button in the menu.
Example of the config.yml file is provided below:
boards_config: "/path/to/resources/boards.json"
debugger_config: "/path/to/resources/debugger_config.yml"
servers_config: "/path/to/resources/servers.json"
password: "hash for super user password"
camera:
  resolution: "3280x2464"
  jpeg_quality: 0
debug_proxy:
  status: "enabled"
  ssh_user: "ssh_username"
  ssh_key_path: "/path/to/private/ssh/key"
notes:
  file_path: "/path/to/resources/notes.html"
When using ssh keys remember about setting proper permissions to the key file!
The file holds configuration and description of each RemoteLab server. It is a list of dictionaries provided in JSON format. Each dictionary contains the following keys:
- server: name of the server,
- key: private SSH key used to connect to the server,
- host: remote host name or IP address or domain,
- ssh_port: SSH port number, available from outside the network,
- ssh_port_backup: backup SSH port number, available from outside the network, usually it is the wireless connection interface port number,
- local_ssh_port: local SSH port number, used when connecting from within network,
- local_ip: local IP address of the server, used when connecting from within network,
- local_ip_backup: backup local IP address of the server, used when connecting from within network,
- port: web server port number,
- status: status of the server, can be either active or inactive,
- api_key: API key used for authentication when connecting between RemoteLab servers,
- camera: camera configuration dictionary, containing:
- status: status of the camera, can be either active or inactive,
- description: description of the camera view,
- panel: panel configuration dictionary, containing GPIO port configuration,
each port number is a key providing configuration for itself:
- direction: direction of the GPIO port, can be either input or output,
- inverted: boolean value (true or false) determining if the port logic is inverted,
- default: default state of the port, can be either high or low, only for output ports,
- pull: pull configuration for input ports, can be either up (pull up), down (pull down) or no (no pull up or pull down), only for input ports,
- description: description of the port to show up in the panel.
An example of the servers.json file is provided below:
[
    {
        "server": "server_name",
        "key": "private_ssh_key",
        "host": "remote_host_name",
        "ssh_port": "ssh port",
        "ssh_port_backup": "backup ssh port",
        "local_ssh_port": "local ssh port number",
        "local_ip": "local IP address",
        "local_ip_backup": "local backup IP address",
        "port": "web server port number",
        "status": "active or inactive",
        "api_key": "3971e0751ff1396cbc4cbf7d7e1e4d93ceb9f74fcdfe37e, some random string",
        "camera": {
            "status": "active or inactive",
            "description": "Some description of the camera view"
        },
        "panel": {
            "gpio": {
                "port number": {
                    "direction": "input or output",
                    "inverted": "true or false",
                    "default": "high or low only for output",
                    "pull": "up, down or no only for input",
                    "description": "Some description"
                }
            }
        }
    }
]The file holds configuration and description of each development board provided by RemoteLab. It is a list of dictionaries in JSON format. Each dictionary contains the following keys:
- id: unique identifier of the board,
- board: name of the board,
- debugger: name of the debugger service used for the board,
- server: name of the server where the board is located,
- port: port number under which the debugger service is available,
- serial: serial number allowing identification of the board,
- features: list of features available for the board,
- status: status of the board, can be one of the following: active, inactive,
- debugger_service: name of the debugger service used for the board.
debugger_service is the name of the debugger service provide with the configuration in the debugger_config.yml file. It allows to determine which debugger service is used for the board.
status is used to determine if the board is currently active and available for use. Super user can view all available boards even if it is inactive.
An example of the boards.json file is provided below:
[
    {
        "id": "1",
        "board": "Nucleo-L476RG",
        "debugger": "ST-LINK V2",
        "server": "servername",
        "port": "3001",
        "serial": "001122334455",
        "features": [
            "DAC1",
            "ADC1",
            "LED_ON_BOARD"
        ],
        "status": "active",
        "debugger_service": "openocd"
    }
]This file allows to configure each debugger service with more granularity. The services section allows to define available debugger services. Each service has a dir and executable key. The dir key points to the directory where the debugger service is located, while the executable key points to the executable file of the debugger service.
The boards section allows to define available boards. Each board has a file key pointing to the configuration file for the board, a search key pointing to directories where additional scripts can be found, and a command key which is a list of commands that will be executed when the debugger service is started for the given board. The board section tends to recreate usage of OpenOCD debugger.
Example of the debugger_config.yml file is provided below:
services:
  openocd:
    dir: "/home/pi/openocd/"
    executable: "/home/pi/openocd/src/openocd"

boards:
  Nucleo-L476RG:
    file:
      - "/usr/local/share/openocd/scripts/board/st_nucleo_l4.cfg"
    search:
      - "/home/pi/openocd/"
      - "/home/pi/openocd/tcl/"
    command:
      - "reset_config srst_only srst_nogate connect_assert_srst"
      - "init"
- "reset halt"It allows to manage all connected development boards. It allows to:
- reset microcontroller's core (only for openocd),
- halt microcontroller's core (only for openocd),
- resume operation of microcontroller's core (only for openocd),
- restart debugger service (either openocd or stlink depending on the configuration).
It also provides the port number under which the remote connection to debugger for a given board is available.
Each board has a status field that determines operation of the debugger service associated with given board. Three states are available:
- established, connection with the debugger session was established and it is currently active, unless you terminate current debug session another one cannot be started,
- online, debugger service is active and waiting for incoming connections,
- offline, debugger service is not running. It can be started using Start or Restart button.
Along side with development board model, dedicated serial device and features are displayed. Serial device allows to directly connect to the development board and communicate with it. Features are tag-like entities. Since each development board is equipped with a shield it greatly enhances capabilities of the development board. The given tag corresponds to port number in the shield schematic, thus allowing to determine what additional devices are connected or what MCU ports could be used for operation.
The PDF with the schematic for STM32 shield board can be found here. The PDF with the schematic for Pico shield board can be found here.
In addition, the health status is being displayed. If a smiley face is being displayed it means that the debugger service is operational. However, when a warning is being displayed it means that the debugger service is not running. In this case restart of the debugger is recommended.
In addition to providing path to serial device it is possible to open a serial console via web interface and directly read/send data and plot in real-time.
The serial console offers information to what serial port it was connected and to which development board. More over, it is possible to enable:
- auto scrolling (enabled by default),
- append CR,
- append LF,
- local echo (enabled by default).
The console automatically pulls data from serial device available on the server and sends it to web interface. It is possible to clear the console or stop data reception. Refresh rate for pulling data from serial device can be adjusted. It is possible to change it between 200 ms up to 2 seconds wit a 50 ms step. Default value is set to 500 ms.
The serial console supports multiple simultaneous connections. Thanks to this two or more users will have exactly the same data transmitted to the serial console. Sending data from web interface to serial console is unaffected, everything which is sent by eah user will be sent to the serial device. In other words, transmission is also shared.
A buffer was implemented to store a given number of bytes. The buffer is implemented as a rolling buffer, meaning that when the buffer is full the oldest data is removed.
Attention! Currently, sharing of a serial console between users is not supported. The received that will be send randomly to all connected recipients. The status server provides information if the console is being used (1 next to the serial device) or is it idle (zero value next to the serial device).
When in serial console it is possible to plot a graph in real-time. The data sent via serial port is parsed and displayed on a graph. By default plotting is disabled. It can be enabled by checking the Use plotting checkbox.
Attention! The data has to be sent in specific format in order to be parsed correctly. The format is following:
value1;value2;value3;...[\r]\n
where values are separated by semicolon and the line ends with carriage return and new line characters (at least a new line is required).
The number of values is not limited. However, the number of values should be kept constant and consistent throughout the whole transmission. Thus, no additional values should be added or removed. Additionally, each value must be an integer or float value.
An example of a proper data frame:
10;2.1;-3.4;0.0\r\n
Above consists of 4 values: 10, 2.1, -3.4, 0.0.
Once the data is received it is parsed and displayed on the graph. The number of values is automatically detected and the number of curves is set accordingly. No manual configuration is required.
It is possible to clear the plot or purge it. Clearing the plot removes all data from the graph leaving curve configuration intact, thus preserving line colors. Purging the plot removes all data and curve configuration. It is useful when the data format has changed and the graph needs to be reinitialized.
The number of retained samples can be adjusted using the MAx Samples number field input below the plot. The default value is set to 10 samples.
It is possible to use a counter as X axis values. By default each sample is timestamped and added to the graph. However, it is possible to use a counter instead. The first value of a data frame is interpreted as a counter value. Therefore when counter usage is enabled the first value is used as a counter and will not be displayed on the graph.
It is necessary tu Purge the plot after enabling or disabling the counter usage.
The plot offers simple statistics calculated based on received data:
- last received value,
- minimum value,
- maximum value,
- average value.
Additionally each dataset provides color identification for easier distinction between curves.
It provides a video-like experience. It allows to stream image directly from a connected camera device. For example, the camera can be placed directly above the connected boards in order to provide live vide feedback.
There is a possibility to enable auto-refresh option. This allows to refresh the image every 10 seconds without user's input.
Chat application allows users of the RemoteLab platform to communicate with each other. It is a simple chat application that allows to send messages to all users connected to the RemoteLab platform. Notifications are provided when a new message is received.
User is identified by a unique generated name. Moreover, a user (16 characters) nickname can be set. The nickname is used to identify the user in the chat. It is possible to change the nickname at any time.
The server allows to extend available features presented to the end user after providing super user password. This feature allows to manager resources more precisely and unlocks additional capabilities.
The password can be configured inside RemoteLab/resources/config.yml file. For password key enter MD5 hash of the password.
Terminal console (on the server) is available via web interface. It allows to execute commands with shell-like experience. There are some limitations, mainly when executing a command it should finish. Only when the command finishes it will provide the output of the command, thus commands like watch, less will not work.
A view ith system information is available. It offers a summary about, CPU ussage, memory, usage, network statists and currently logged in users.
Besides options available for normal user, now the control of the debugger service is more granular. Super user can start or stop the debugger service independently.
Besides board statuses, the super user also has a information who currently has an active and established connection. When a connection with debugger is established, additional information, who is using the board, is also displayed. This allows to determine who is currently using the board and who has an active connection.
Besides streaming images with auto refresh now it is possible to stream live video and configure the settings of the camera. Currently, Raspberry Pi Camera Modules are being supported with two different version of python libcamera library that is detected automatically.
It is possible to set:
- image resolution,
- rotation,
- horizontal flip,
- vertical flip,
- brightness,
- contrast,
- saturation,
- sharpness.
Also direct links for image and video stream are available.
Each instance of RemoteLab platform supports API communication between servers in scope of:
- managing development boards (Boards panel),
- video streaming (Video panel),
- serial console (Serial port in Boards panel),
- GPIO control (Panel panel).
Authentication is done via API key provided in server configuration file (servers.json).
When adding new servers remember to extend ALLOWED_HOSTS list inside RemoteLab/settings.py file.
Additionally, when connecting to a given RemoteLab server all debug ports are automatically forwarded via SSH tunnel. The connection is done for each server. Thus, no separate connection is required when using a board located on server A, while being connected to server B.
The functionality is provided with utils/DebugProxy.py, and utilizes and configured inside boards/views.py.
Configuration is done inside config.yml file. The debug_proxy section allows to enable or disable the feature, set SSH user and path to private SSH key used for connection. This feature requires a dedicated (preferably) SSH user with limited permissions. Remember about setting proper permissions to ssh keys.