An interactive visualization tool that displays Bit-Byte (mentor-mentee) relationships using a network graph. This project visualizes connections between "bytes" (mentors) and "bits" (mentees) from a CSV file using Cosmograph, a WebGL-based graph visualization library.
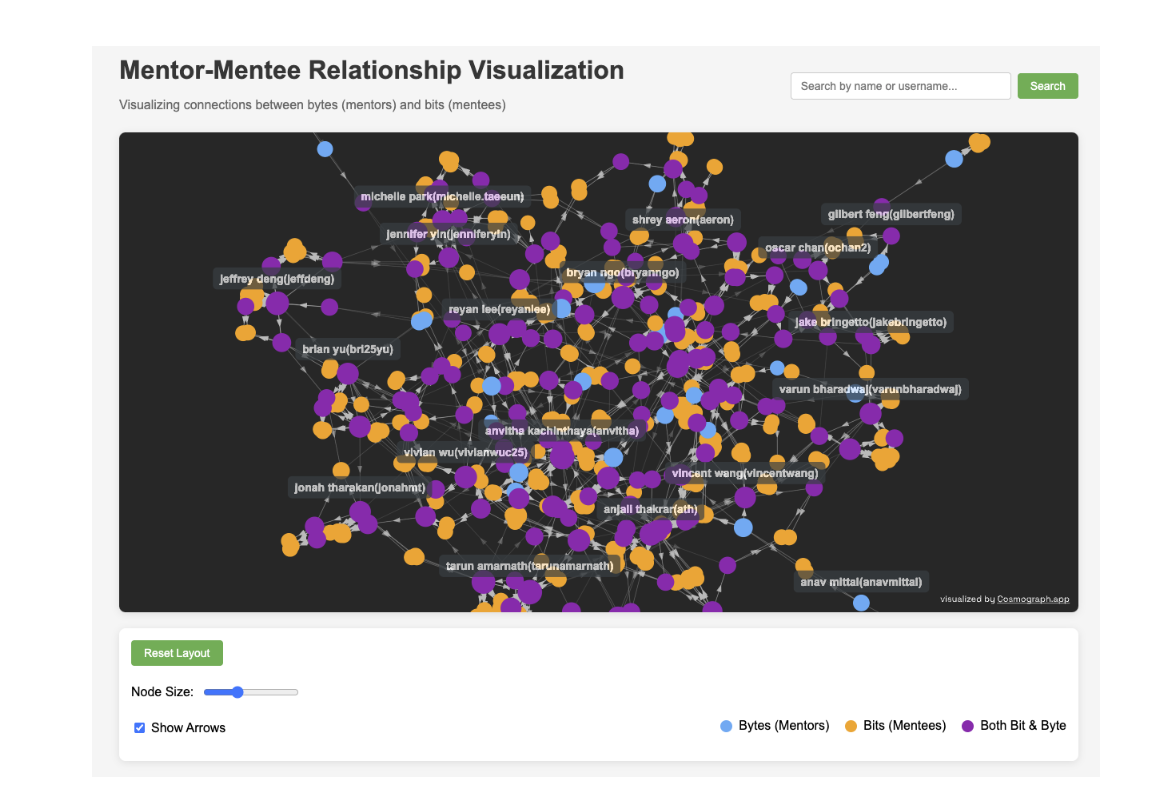
- Interactive Network Graph: Visualize complex mentor-mentee relationships in an intuitive force-directed layout
- Node Highlighting: Click on any node to see detailed information about that individual's relationships
- Search Functionality: Quickly find specific individuals within the network
- Interactive Controls: Adjust node size and toggle arrow visibility
Access the live visualization: https://waihankan.github.io/mentor-mentee-visualization/
This is also available in tree.txt.
.
├── index.html                 # Main HTML entry point
├── package.json               # Project dependencies
├── public
│   └── bit_byte_tree.csv      # CSV data file
├── src
│   ├── components
│   │   ├── graph.js           # Core visualization
│   │   └── graphConfig.js     # Configuration options
│   ├── main.js                # Application entry point
│   ├── styles
│   │   └── style.css
│   └── utils
│       └── dataProcessor.js   # data processing
- Node.js (v14 or newer)
- npm or yarn
-
Clone the repository:
git clone https://github.com/waihankan/mentor-mentee-visualization.git cd mentor-mentee-visualization -
Install dependencies:
npm install
-
Start the development server:
npm run dev
-
Open your browser and navigate to
http://localhost:5173
To visualize your own mentor-mentee relationships:
- Replace the
public/bit_byte_tree.csvfile with your own data - Ensure your CSV has two columns:
byte(mentor) andbit(mentee) - Format should be:
name(email username)in each cell
- Cosmograph for the visualization library.
- Artem Shumay for mentoring.