Note:
If you like data-driven insights but aren't so into MS PowerBI, a new online version of the dashboard is now available at https://cabinette-frontend.vercel.app/. Check out the cabinette-frontend repository for source code and details.
The goal of this project is to highlight candidate locations for further investigation into the possibility of providing a new, low-cost accommodation option for visitors of U.S. National Parks.
Identify and rank candidate locations for new, small‑footprint cabin sites within a 1-hr driving distance of U.S. National Park and Monument visitor centers to maximize expected demand (occupancy) while minimizing regulatory and hazard risk, given current competition and access constraints.
Parks: U.S. National Parks and National Monuments in the Intermountain Region and part of the Pacific West Region (i.e., Regions 6-10, internal designations which include parks in Texas, Oklahoma, New Mexico, Colorado, Utah, Wyoming, Arizona, California, Idaho, Nevada, Oregon, Washington, and Montana)
Geography: private land within 45 miles of park visitor centers; excluding protected critical habitat areas (hopefully excluding flood zones in a later iteration)
Demand proxy: NPS visitation (monthly 5-year historic average)
Competition proxy: low-cost lodging density (motel, hostel)
Logistics: road distance (distance to utilities and gas station in a later iteration)
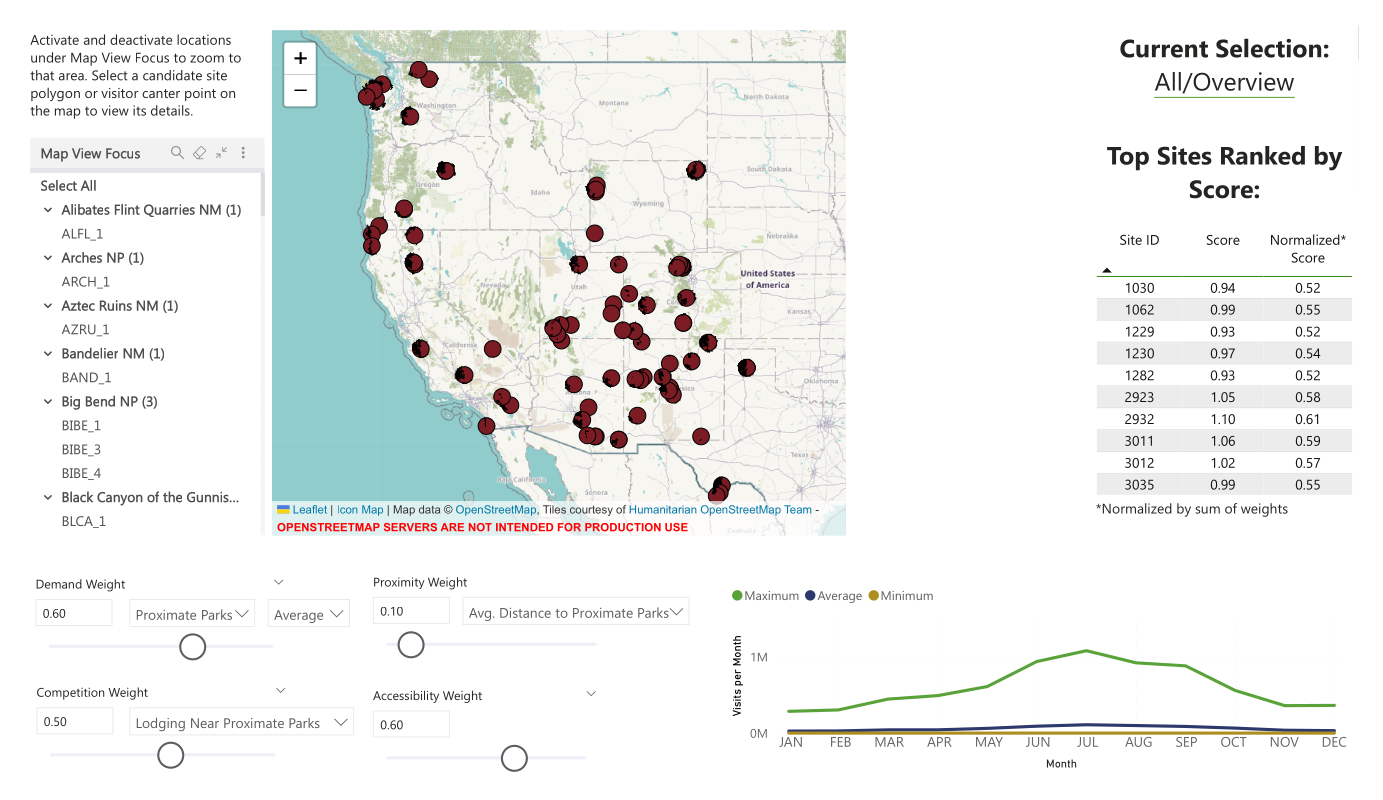
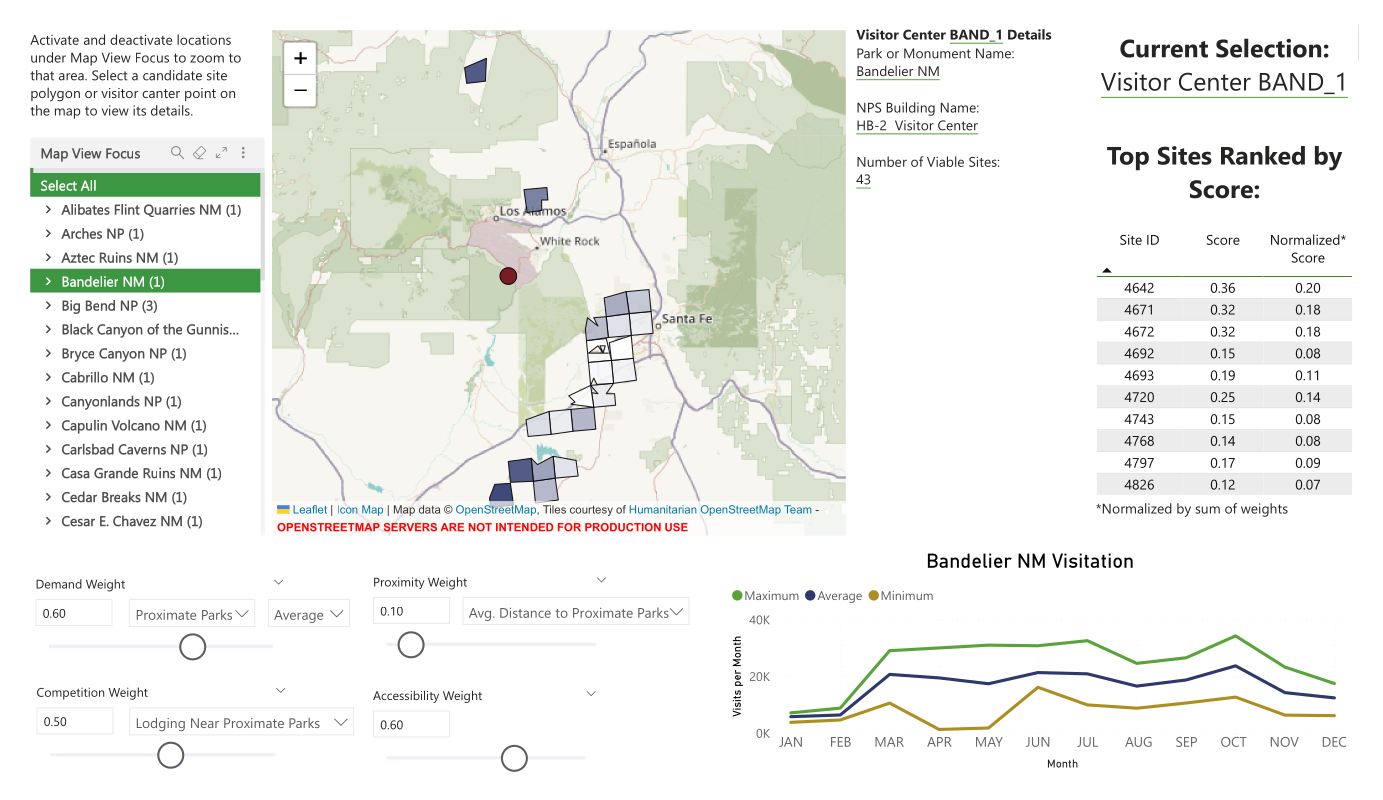
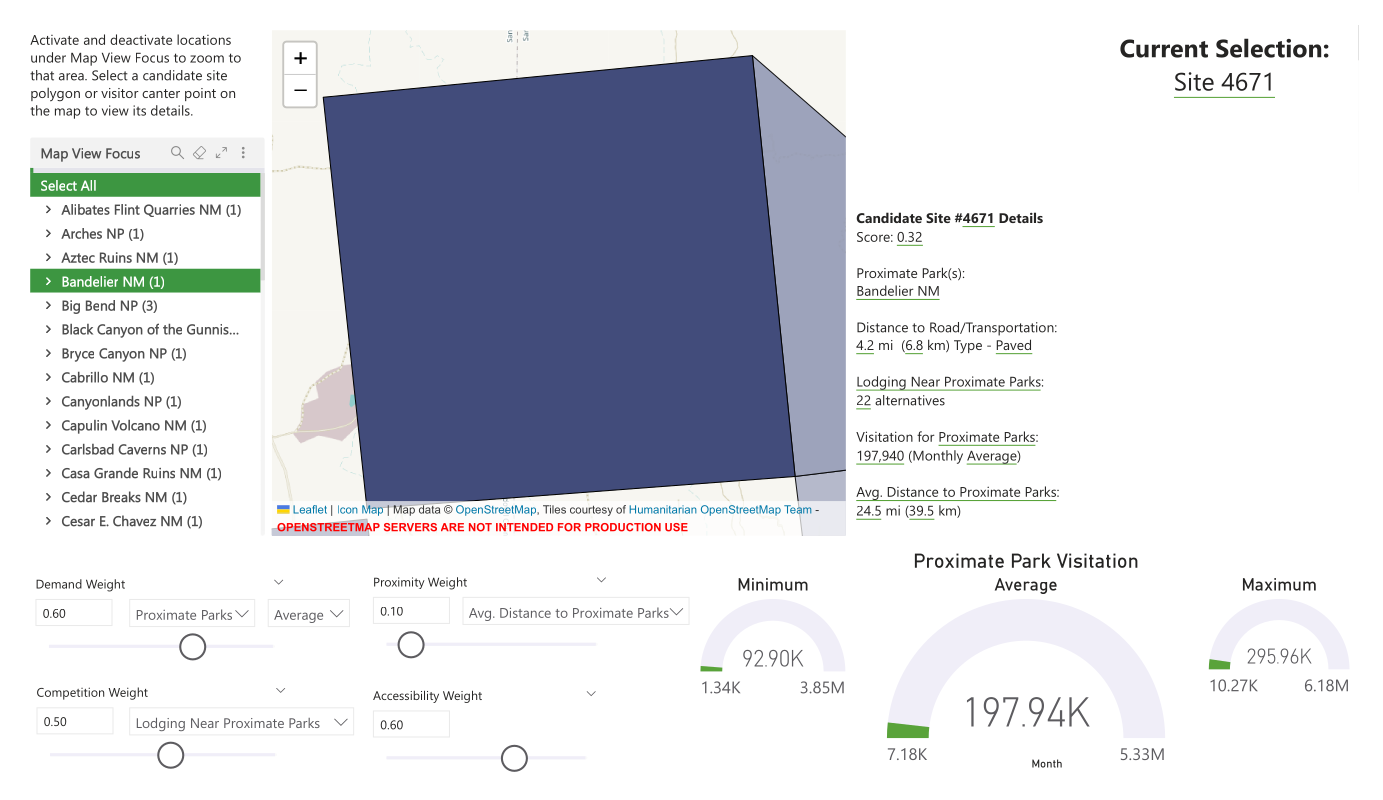
Deliverables: top 10 sites overall and by visitor center and a basic dashboard organizing sites and scores
- Clear top‑ten recommendations overall by score
- Clear top‑ten recommendations per visitor center by score
- Visible changes in scoring as weights are adjusted in the dashboard (update within 1 minute)
- Instructions and tools to reproduce the analysis
- Accessible PowerBI report file
See DATA_SOURCES.md for details on data sources and acquisition. Much of the data (excepting PAD_US) is consolidated for download from Zenodo. The directory structure used was:
──data
  └───raw
      ├───crithab
      │   └───crithab_all_layers
      ├───DOI_Unified_Regions
      ├───NPS_Buildings
      ├───NTAD
      │   └───NTAD_North_American_Roads_1758222247102814161
      │       └───b3c1aa91-5b93-4974-a8a6-d28e8948309d.gdb
      ├───OSM_tourism
      ├───PAD-US
      │   └───PADUS4_1Geodatabase
      │       └───PADUS4_1Geodatabase.gdb
      └───Query_Builder_for_Public_Use_Statistics_2020-2024.csv
- PostgreSQL (
psql,shp2pgsql) - PostGIS extension
- GDAL (
ogr2ogr) - All tools in system PATH
Create the database (and user, if needed) and enable PostGIS:
createuser -P <your_username>
createdb -U <your_username> <your_database>
psql -U <your_username> -d <your_database> -c "CREATE EXTENSION postgis;"
Recommended: Set up .pgpass file or export PGPASSWORD="your_password".
Please see DATA_SOURCES.md for data sources and acquisition. Unzip any compressed data to data/raw/ as shown in the directory structure in the Data section.
Edit run_sql.sh to set database details.
Set permissions:
chmod +x run_sql.sh
Run:
./run_sql.sh
The top 10 candidate sites are summarized as a table visual in the Power BI report and update as weights are adjusted. These sites are filtered and reranked if a visitor center is selected on the map. If either a visitor center or a specific site is selected, the dashboard will display pertinent data. The performance analyzer in Power BI suggests that the longest processing time is for the map visual (~2.5 seconds), all other processes and queries are almost instantaneous (~1 second).
Download Cabinette_Dashboard.pbix for the interactive dashboard (includes sample data). Note, Power BI Desktop is required to view and interact with the report.
Progress was documented regularly as part of my web portfolio.
I acknowledge that I consulted resources such as GitHub Copilot (GPT-5, GPT-4.1), Icon Map video tutorials, and the Microsoft Power BI Community in the construction of this project.
Victoria Garibay, Ph.D. - Contact Form | GitHub Profile