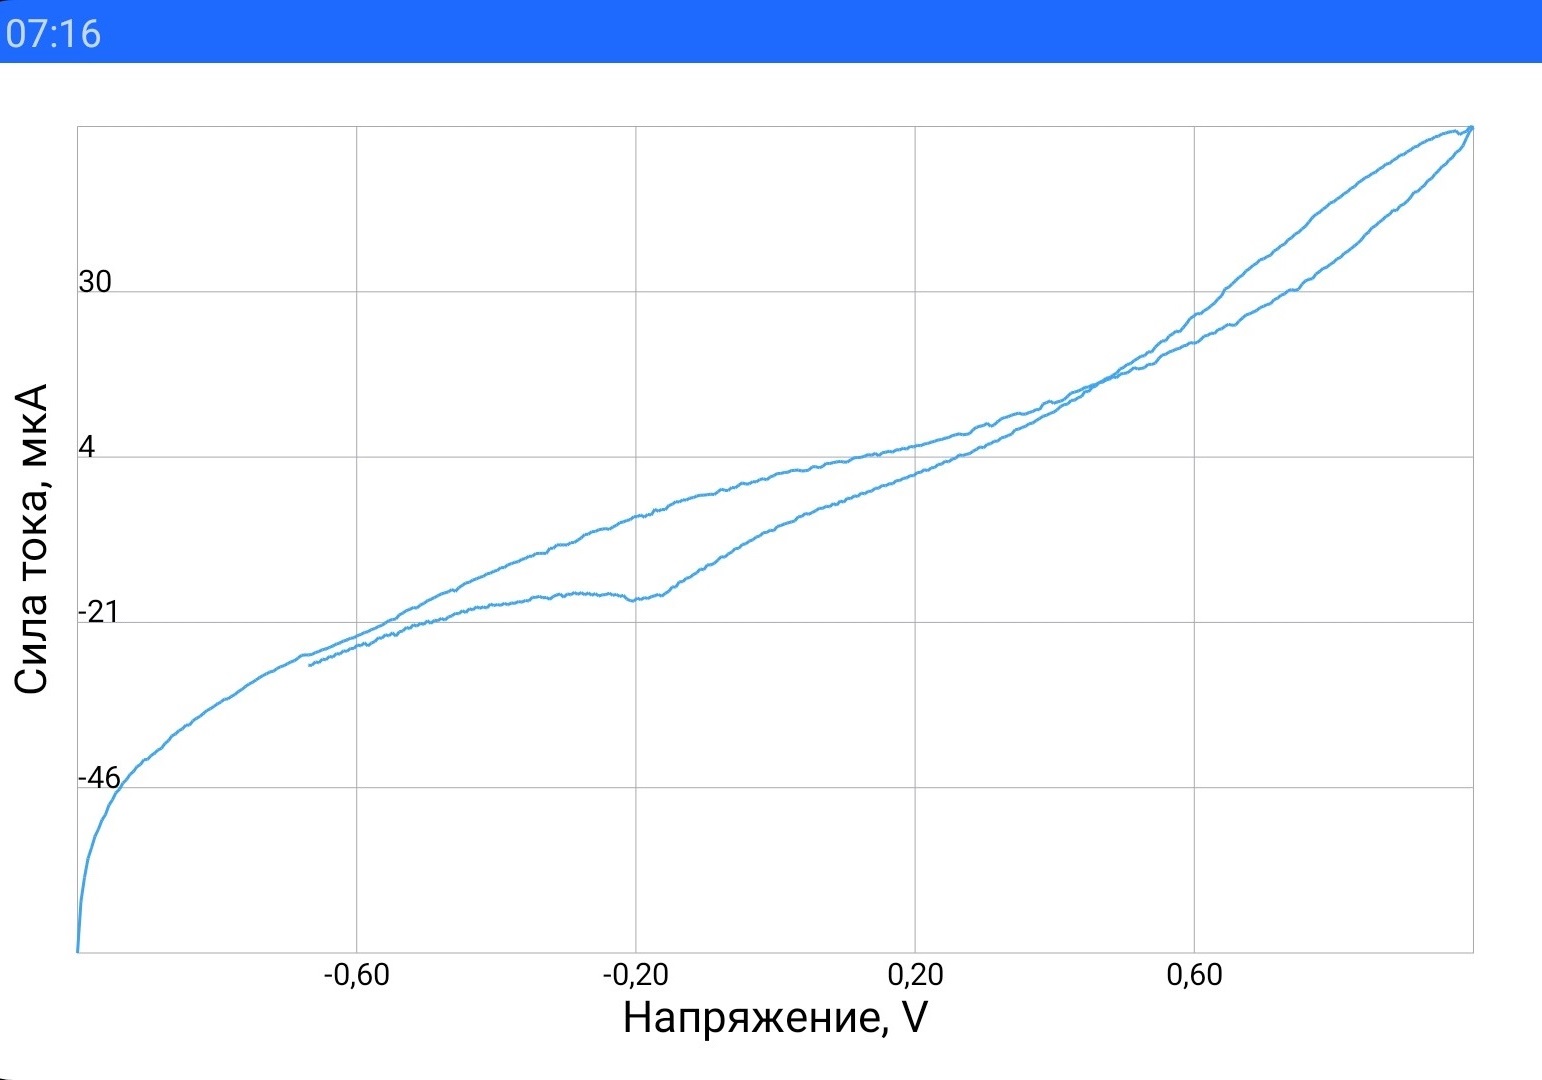
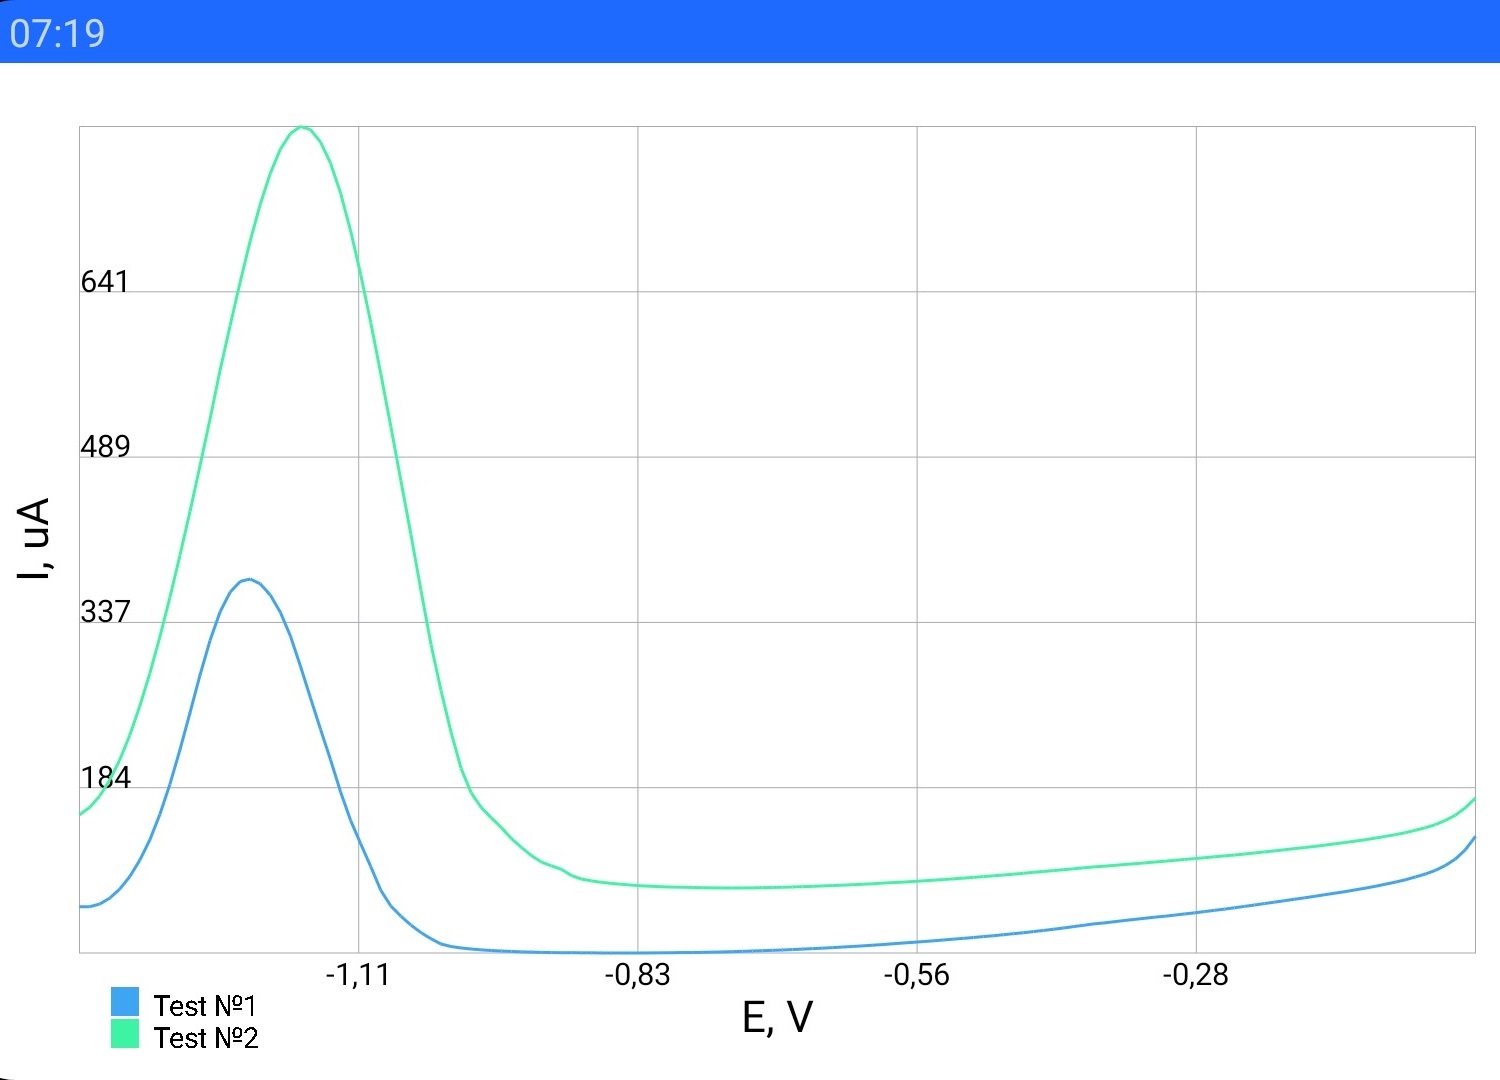
A library for drawing Unlinear Graphs
allprojects {
    repositories {
	...
	maven { url 'https://jitpack.io' }
    }
}
dependencies {
implementation 'com.github.vk59:GraphView-Library:2.0.1'
}1. Firstly, you have to declare a variable of GraphData type. It's necessary to show your data correctly.
The first parameter is ArrayList of Moments (every Moment contains X and Y coordinate of the Graph's point). But it isn't necessary to fill the ArrayList right now (but you can).
private graphData = new GraphData(new ArrayList<Moment>, Color.rgb(61, 244, 165), "Graph №1");graphData.addData(X, Y);There is float variable X and Y.
graphData.setData(arrayListOfMoments);Of course, before that you have to add GraphView to your layout and find that in the code.
private GraphView graphView = findViewById(R.id.graphView);
graphView.addGraphData(graphData);
graphView.drawGraph();
That's all! Your graph is on the display.
graphView.clear;Now graphView forget about all the GraphData objects. Of course, your Data is still saved (in graphData variable). You can add new Moment (point) to graphData, set that to graphView again and draw that.
6. If you want to draw several graphs, you should declare several GraphData variables and add that to GraphView:
graphView.addGraphData(graphData);
graphView.addGraphData(graphData2);
graphView.addGraphData(graphData3);This library generally was used in the 'ISC' application. You can see the code here