Repository for my fifth homework using Python, Pandas and working with APIs, where I use the data from two different APIs in order to determine the tendencies in a place's climate as they get nearer or further from the equator.
Which APIs will I be using?
I am working with two APIs:
- OpenWeatherMap API: they collect and process weather data from different sources such as global and local weather models, satellites, radars and a vast network of weather stations in order to obtain the current weather in a certain place.
- Google Maps APIs: The Places API is one of the APIs that Google Maps offers, and it is a service that returns information about places using HTTP requests. Places are defined within this API as establishments, geographic locations, or prominent points of interest.
What do my notebooks do?
These homework consists of two challenges: WeatherPy and VacationPy.
WeatherPy
In WeatherPy I created a Python script to visualize the weather of 500+ cities across the world of varying distance from the equator, all the data was obtained from the Weather API. I created a series of scatter plots to showcase the following relationships:
- Temperature (F) vs. Latitude
- Humidity (%) vs. Latitude
- Cloudiness (%) vs. Latitude
- Wind Speed (mph) vs. Latitude
Then I ran a linear regression on each relationship, but I separated the plots into Northern Hemisphere (greater than or equal to 0 degrees latitude) and Southern Hemisphere (less than 0 degrees latitude):
- Northern Hemisphere - Temperature (F) vs. Latitude
- Southern Hemisphere - Temperature (F) vs. Latitude
- Northern Hemisphere - Humidity (%) vs. Latitude
- Southern Hemisphere - Humidity (%) vs. Latitude
- Northern Hemisphere - Cloudiness (%) vs. Latitude
- Southern Hemisphere - Cloudiness (%) vs. Latitude
- Northern Hemisphere - Wind Speed (mph) vs. Latitude
- Southern Hemisphere - Wind Speed (mph) vs. Latitude
My code also exports the CSV with the city data for further analysis and each of the plots was saved as a png file. Comments and insights are included within and after each section in the code.
VacationPy
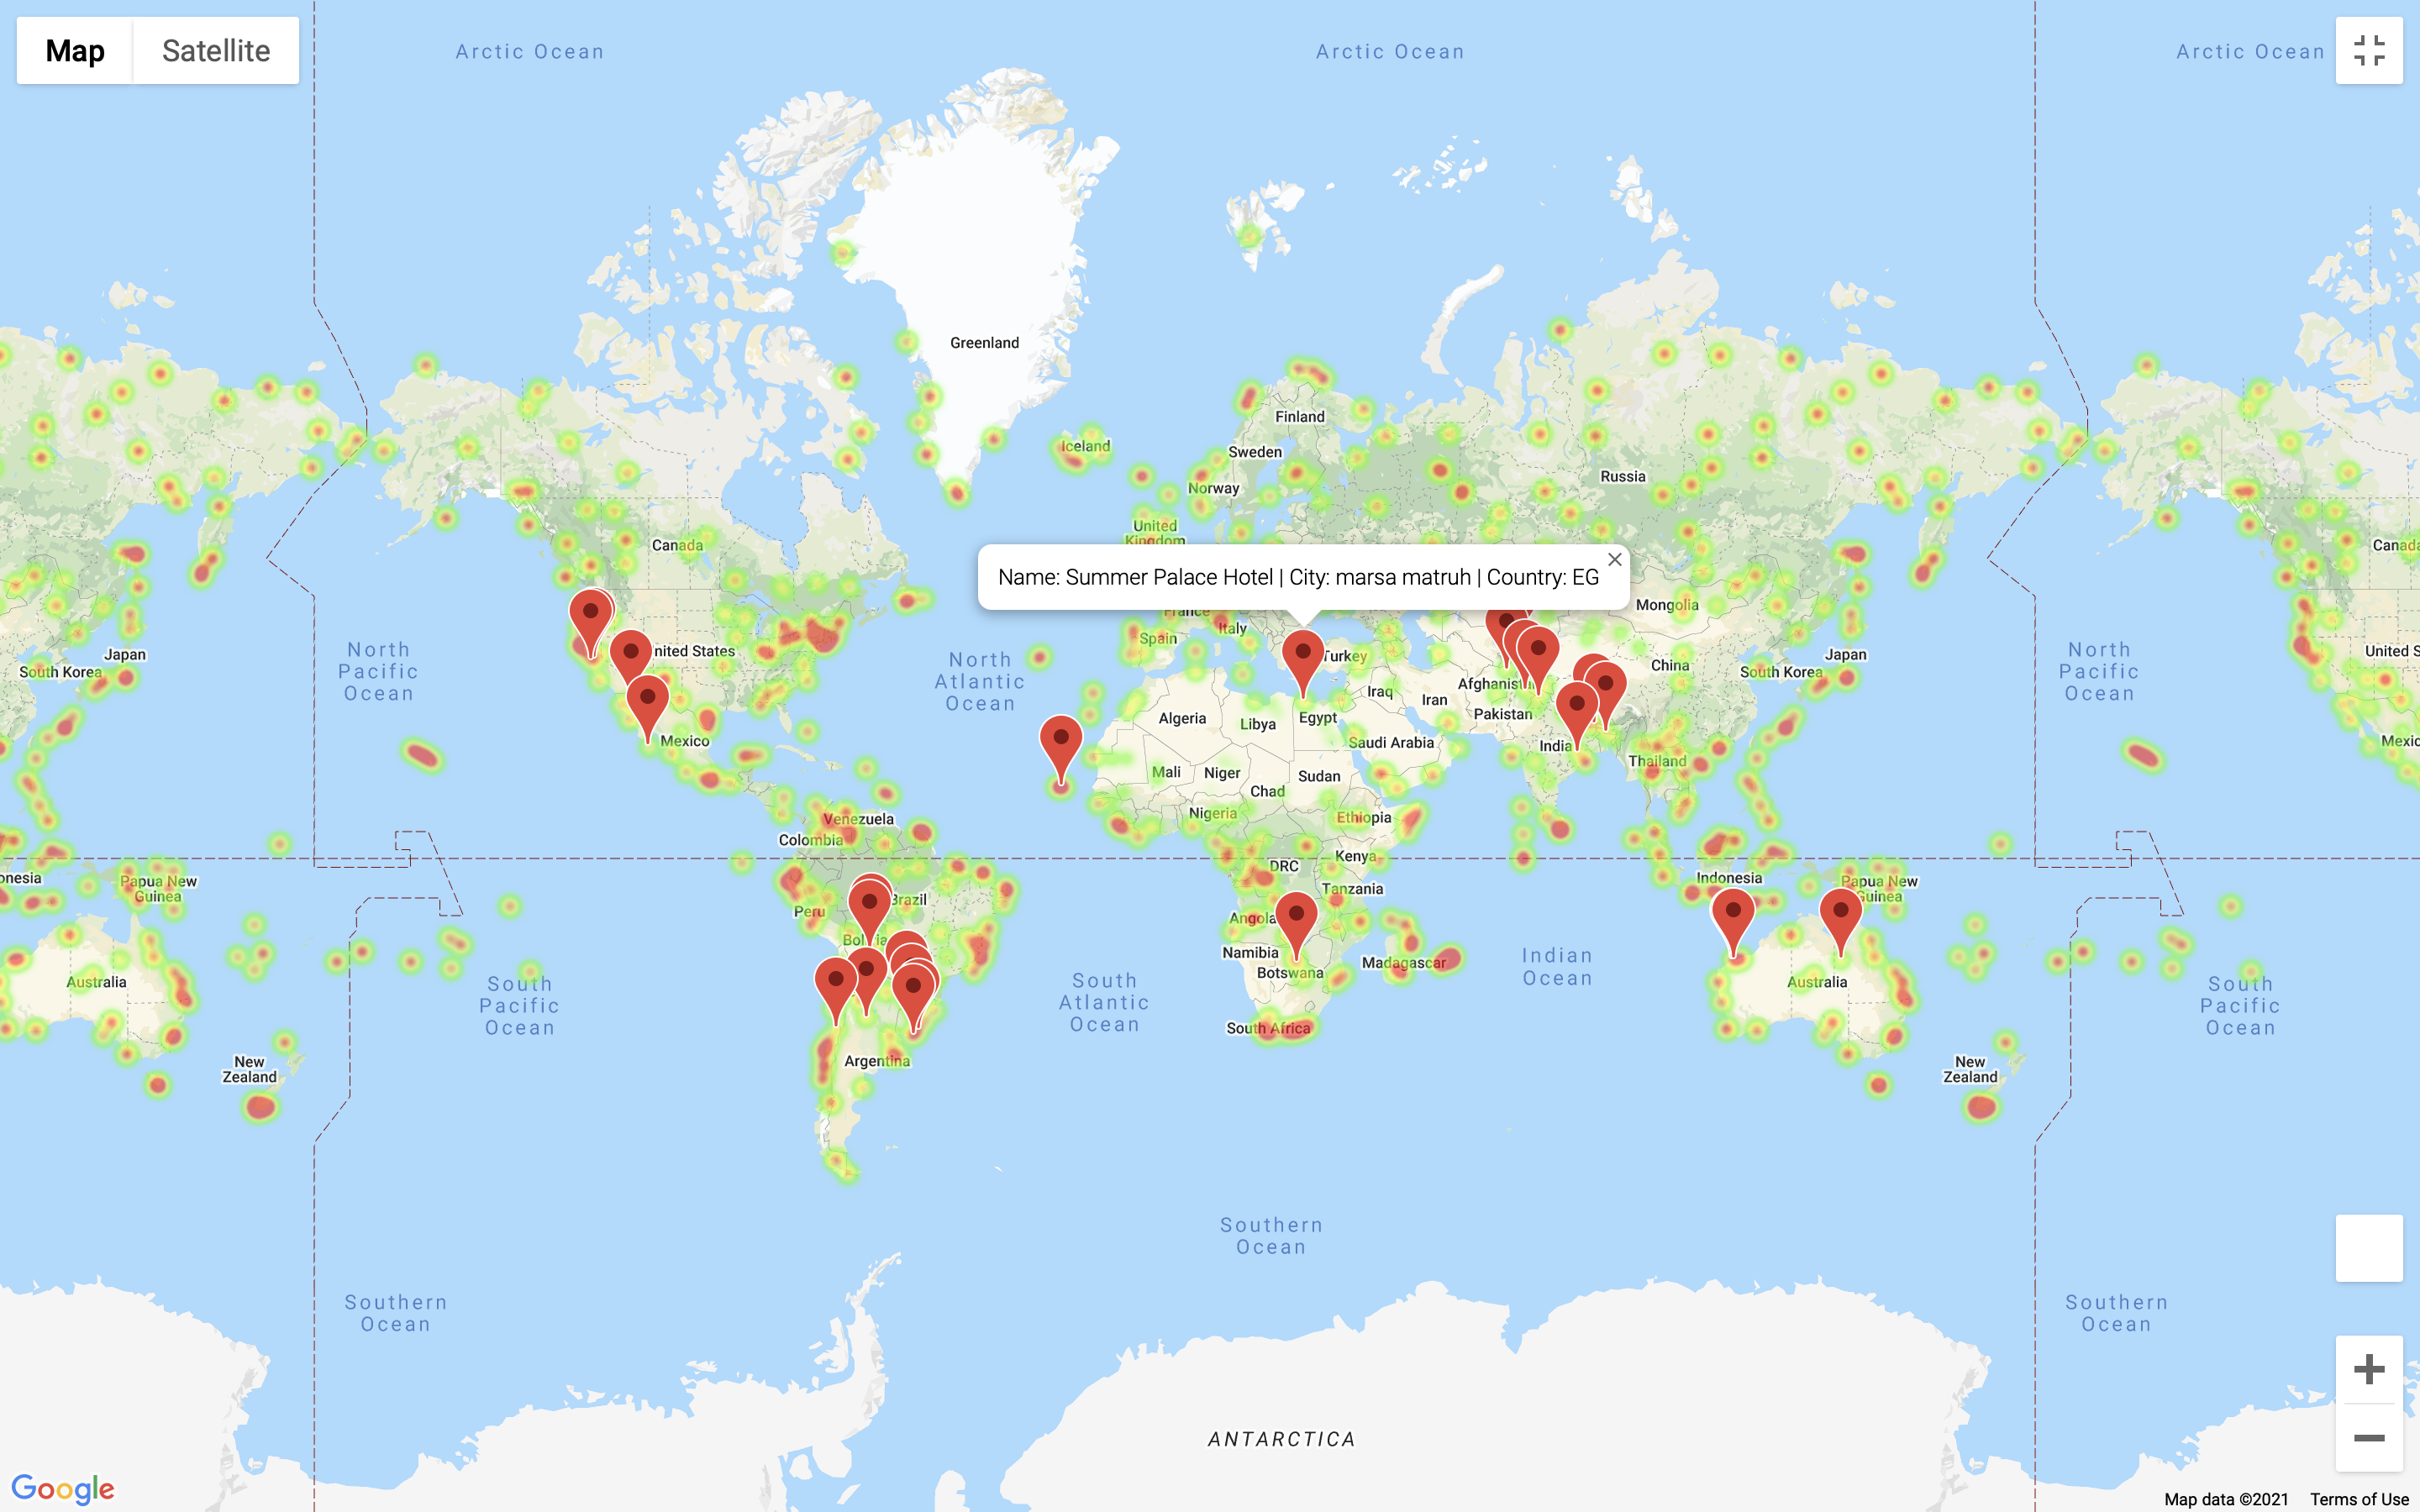
In VacationPy I used the data obtained in the first part to create a heatmap for humidity in the cities obtained in the first part by using gmaps. Then, I set certain conditions for an ideal vacation:
- Temperature between 68 and 86 Farenheit
- Cloudiness of 40% or less
- Humidity between 30% and 50%
After defining these conditions, I used the Places API to obtain hotels nearby the cities that fit my criteria, and added marks to the location of each hotel. The screenshots of these results are attached in a folder inside the directory.
Conclusions
The conclusions from these exercises are simple: the only thing that had a strong correlation to latitude was the temperature: the closer to the equator, the more likely a place will have a higher temperature. Moreso, several hotels in different cities and continents were obtained for my ideal vacation.