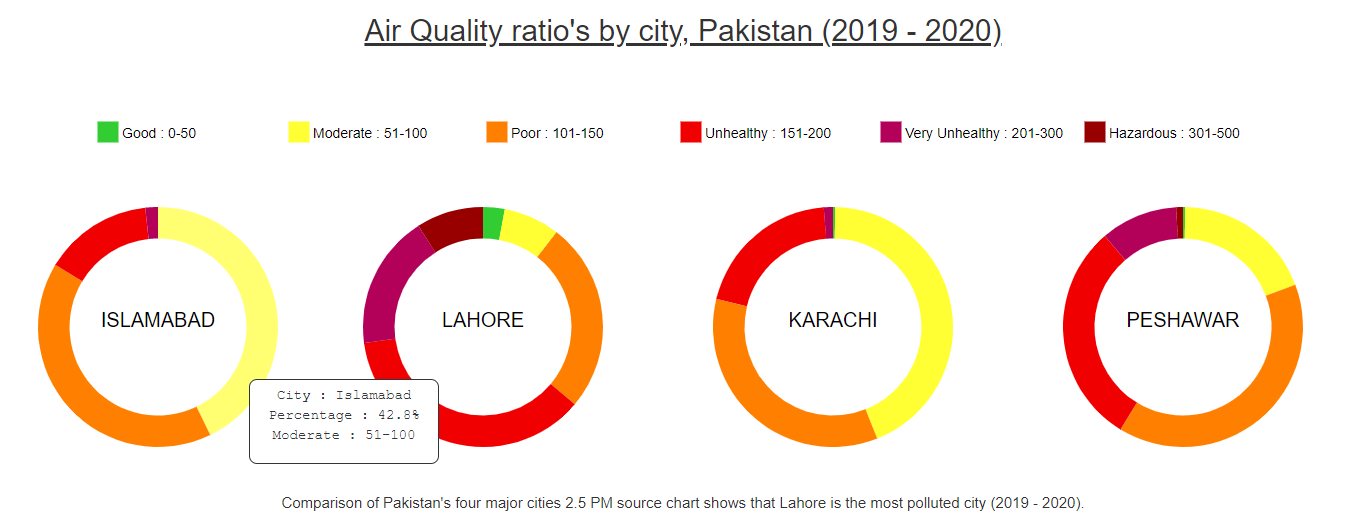
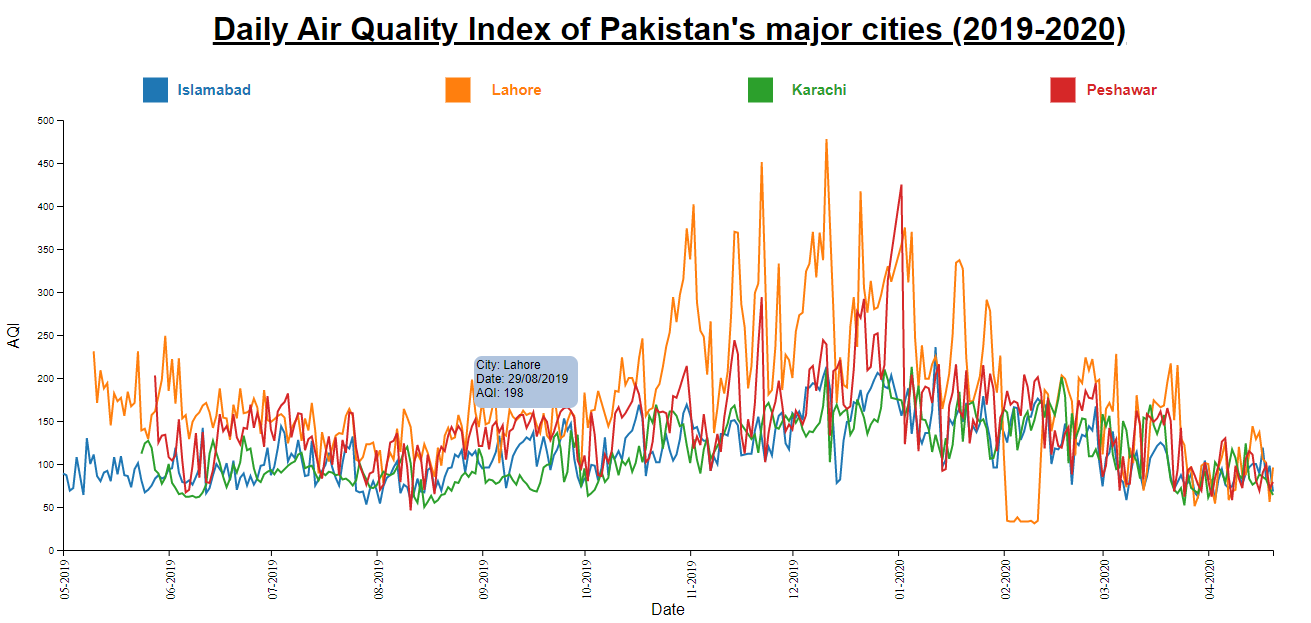
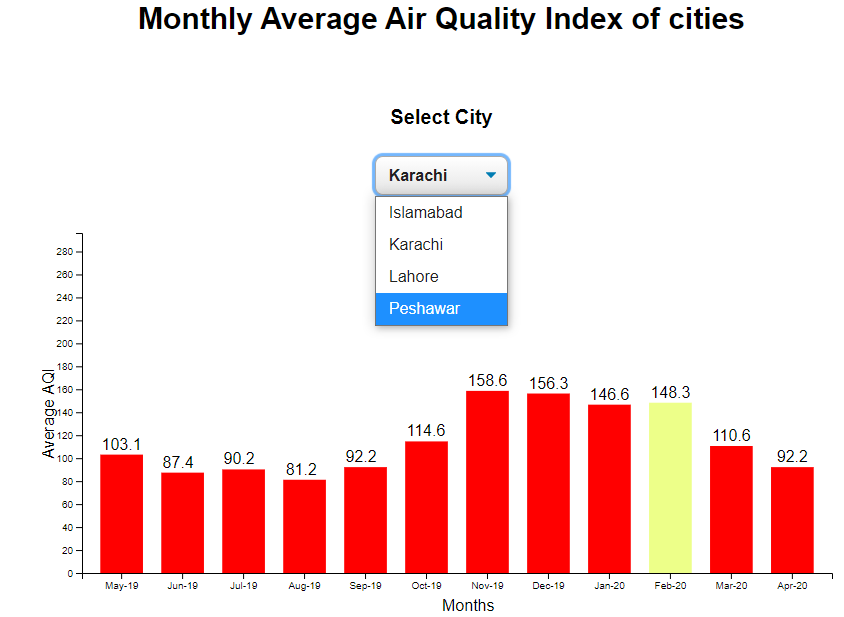
Air quality is a major concern for people in Pakistan and around the globe. In many industrial and urban areas air pollution is causing damage to humans, plants, animals and ozone layer etc. due to release of harmful gases by various resources. In this project, we visualize the data of air quality of four major cities of Pakistan which include Karachi, Lahore, Islamabad, and Peshawar, the air pollutant for which is, Particulate Matter (PM 2.5). The dataset for the study is sourced from an online repository, collected in the time span ranging from May 2019 to April 2020. Three visualizations namely, Bar chart, Donut chart and Line chart are generated. These interactive visualizations are developed using D3.js and provide essential insights of data according to Year, Month, Day or the severity of air pollution. As per the designed visualizations, there has been a significant increase in air pollution during the end of 2019, whereas during the start of 2020, the air pollution started to decrease.
The data set for the project is sourced from :https://opendata.com.pk/dataset/air-quality-index-may-2019-april-2020/resource/decb72cb-1d47-4c2b-8414-33fb01f763d5
| Idiom | Marks | Channels |
|---|---|---|
| Line Chart | Point | Color hue, horizontal position, vertical position |
| Bar Chart | Line | Color hue, horizontal position, length |
| Donut Chart | Area | Color hue, angles |
HTML, CSS, JavaScript libraries D3 and JQuery
Text editor: Visual Code
Step 1: Download Node js from the following link: https://nodejs.org/en/download/
Step 2: Run the following command on Command Prompt: npm install
Step 3: Download D3 framework from : https://d3js.org/
Step 4: Extract the downloaded d3 file
Steo 5: Save the code files and the extracted D3 file into the same folder
Step 6: type the command: 'cmd', in the directory of the folder in Step 5 (as shown in images below)

Step 7: Run the command : npm install in the opeaned CLI, once all the packages are installed run the command: 'http-server -o'
A list of avaliable visualizations would appear and the desired may be choosed.
Vaneeza Mehmood
Noor us Sabah
Maryam Javed
Manahil Haseeb
Syeda Rabiya Arshad