Sources
A how-to guide on using the source-modelling repo to plot SRF files various ways.
All of the tools below can be invoked via the command line, or via Python scripts. See the QuakeCoRE docs for API documentation.
Before you can plot anything, you need to install the visualisation repository. You can do that with pip install git+https://github.com/ucgmsim/visualisation. Assuming you've done that correctly you should be able to execute plot-srf --help and get output like
 Usage: plot-srf [OPTIONS] SRF_FFP OUTPUT_FFP

 Plot multi-segment rupture with slip.

╭─ Arguments ─────────────────────────────────────────────────────────────────────────────────────────────────────────────────────────────────────────────────────────────────────────────────╮
│ *    srf_ffp         FILE  Path to SRF file to plot. [default: None] [required]                                                                                                             │
│ *    output_ffp      FILE  Output plot image. [default: None] [required]                                                                                                                    │
╰─────────────────────────────────────────────────────────────────────────────────────────────────────────────────────────────────────────────────────────────────────────────────────────────╯
╭─ Options ───────────────────────────────────────────────────────────────────────────────────────────────────────────────────────────────────────────────────────────────────────────────────╮
│ --dpi                                       FLOAT               Plot output DPI (higher is better). [default: 300]                                                                          │
│ --title                                     TEXT                Plot title to use. [default: None]                                                                                          │
│ --realisation-ffp                           PATH                Path to realisation, used to mark jump points. [default: None]                                                              │
│ --latitude-pad                              FLOAT               Latitude padding to apply (degrees). [default: 0]                                                                           │
│ --longitude-pad                             FLOAT               Longitude padding to apply (degrees). [default: 0]                                                                          │
│ --annotations           --no-annotations                        Label contours. [default: annotations]                                                                                      │
│ --width                                     FLOAT RANGE [x>=0]  Width of plot (in cm). [default: 17]                                                                                        │
│ --show-inset            --no-show-inset                         If True, show an inset overview map. [default: no-show-inset]                                                               │
│ --install-completion                                            Install completion for the current shell.                                                                                   │
│ --show-completion                                               Show completion for the current shell, to copy it or customize the installation.                                            │
│ --help                                                          Show this message and exit.                                                                                                 │
╰─────────────────────────────────────────────────────────────────────────────────────────────────────────────────────────────────────────────────────────────────────────────────────────────╯
Note
You can get help text for all the plotting tools we describe by
passing the --help flag.
You need plot-srf. With the visualisation repo installed execute
$ plot-srf SRF_FFP OUTPUT_PLOT_FFPThis will create a plot showing the segments in the SRF, slip across each segment, and annotated contours for time.
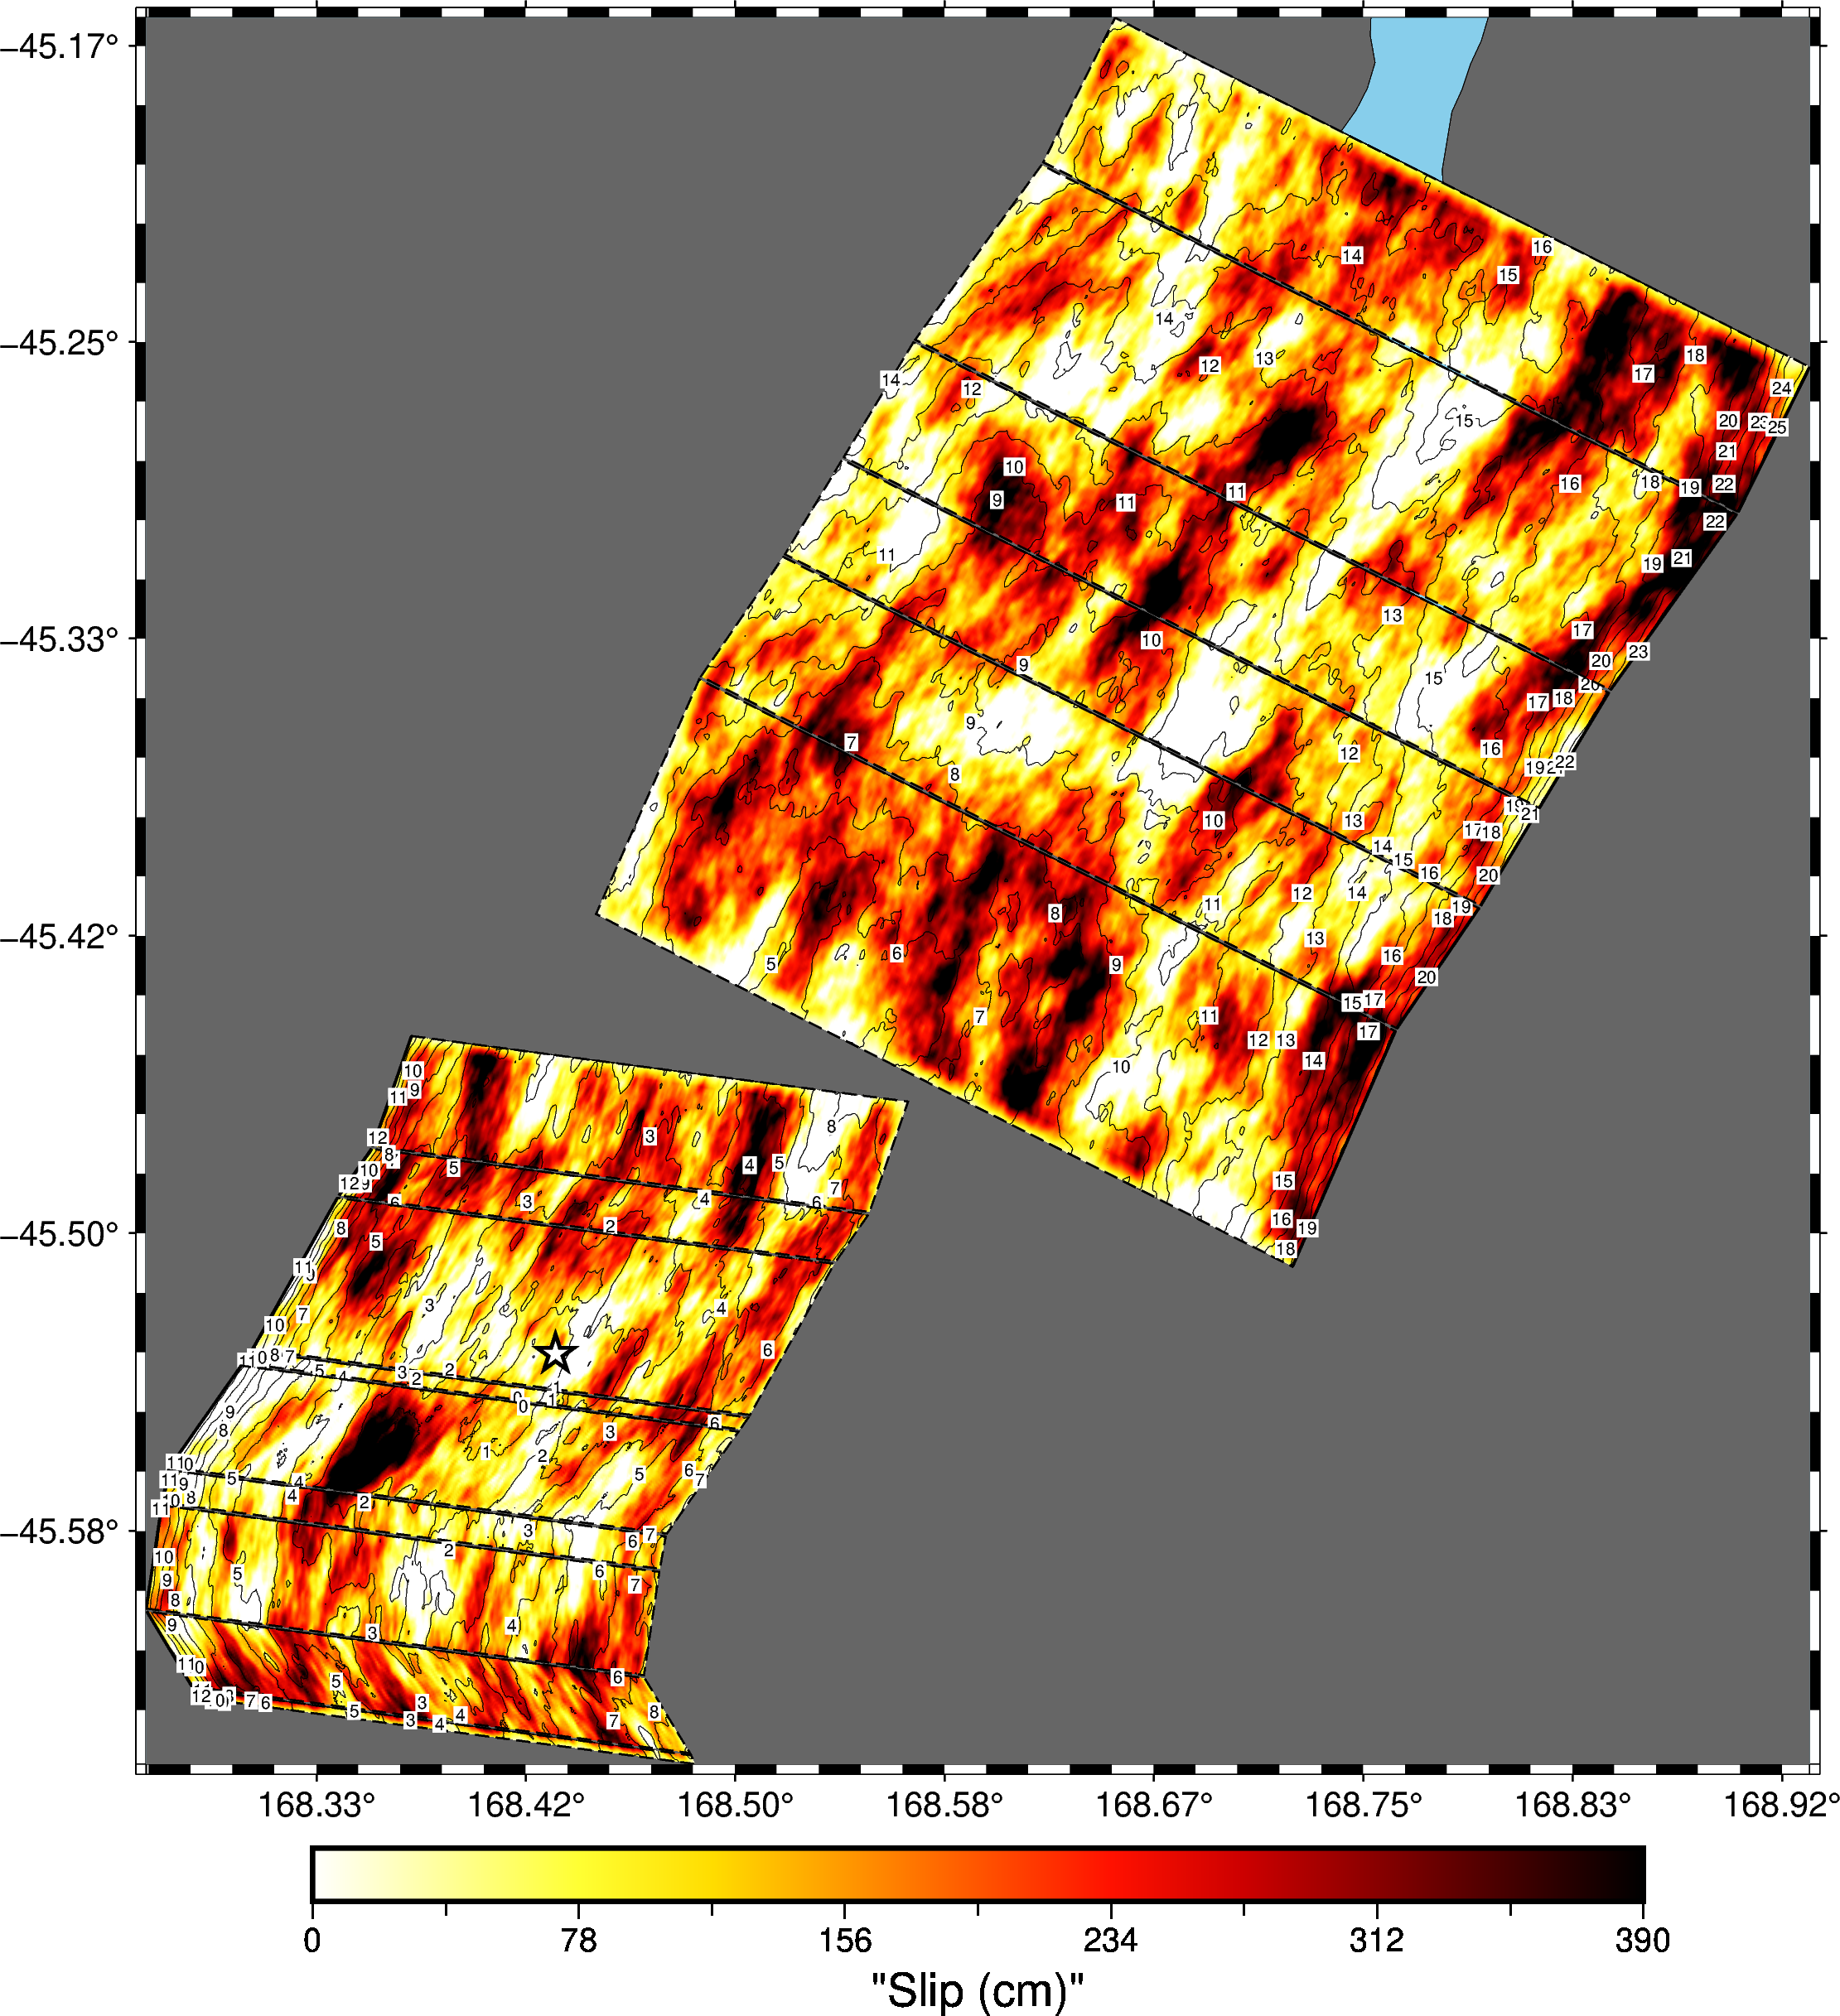
In the above example, the rupture jumps between two segments. The metadata for the jumping behaviour is stored in the new realisation format. Hence, to have the jumps plotted, you must provide the realisation to the tool.
$ plot-srf SRF_FFP OUTPUT_PLOT_FFP --realisation-ffp REALISATION_FFPSee the help text to find more formatting options. You will probably be interested in --title and the padding options.
Note
If your rupture is especially large, you'll want to disable the
annotations feature with the --no-annotations flag.
It often helps to provide an overview map that helps the reader know where you rupture is occurring relative to the whole country. To see one, pass the --show-inset flag to plot-srf.

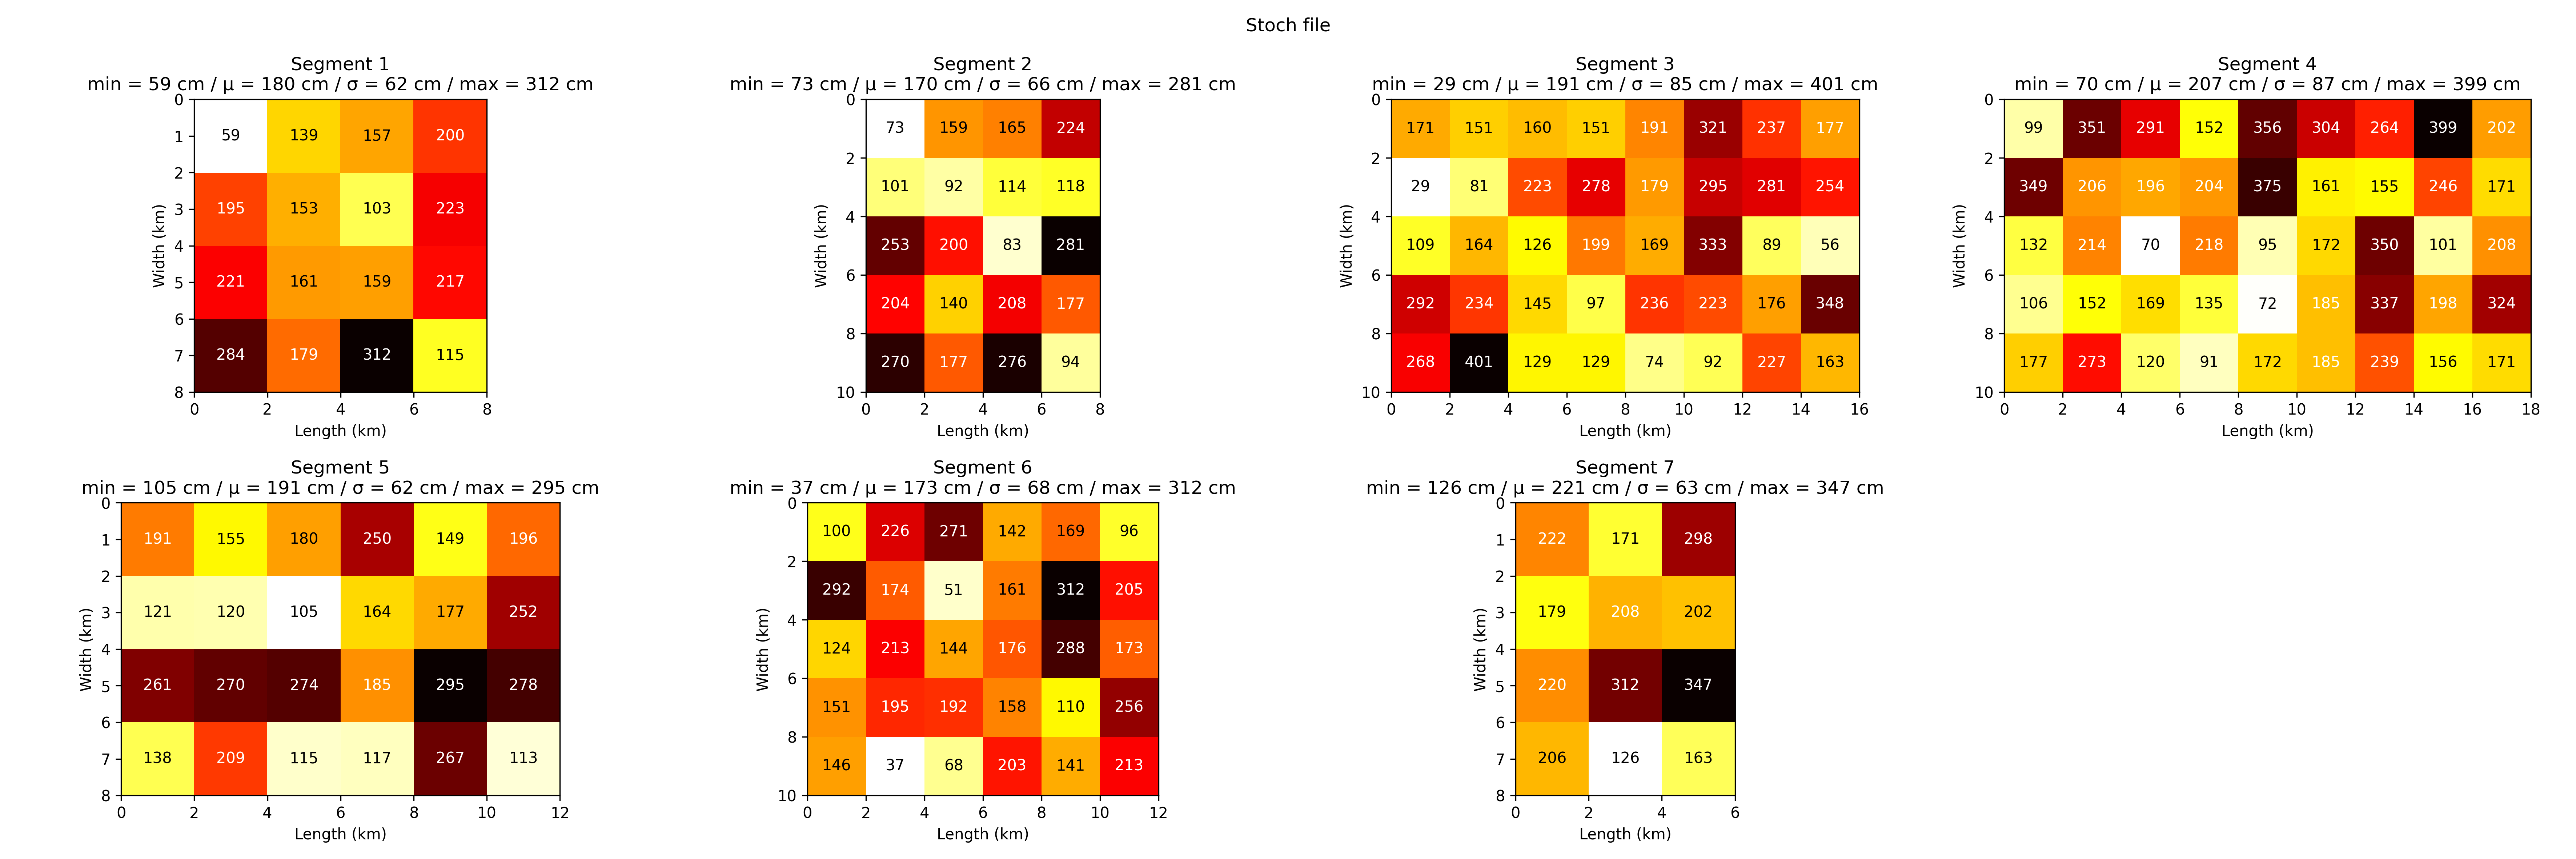
Slip models are downsampled at a low resolution and provided to the high frequency simulation code. These stochastic input files (.stoch files) contain most of the same information as the SRF files. To plot a stoch file, run
$ plot-stoch STOCH_FILE OUTPUT_FILE --title 'Stoch file' --width 40 --height 20Adjust the title, height and width to best suit your plots. Each segment of the stoch file is plotted, with the slip statistics and slip in each patch.
The tool for this job is plot-srf-moment. To plot the SRF moment for a given SRF file type
$ plot-srf-moment SRF_FFP OUTPUT_PLOT_FFPThis will give you a plot of moment rate against time.

If you have a realisation file for the SRF in the new format, you can break this plot down for each segment in the rupture. This is achieved via the --realisation-ffp flag.

In this case, you can use the plot-srf-cumulative-moment tool.
$ plot-srf-cumulative-moment SRF_FFP OUTPUT_PLOT_FFPWhich produces the cumulative moment function for the SRF and plots it.

The shaded area under the curve represents the time for the rupture to release 5-95% of its moment.
As you'd expect, you can break this down further to get the cumulative moment on each segment — if you have a realisation file for this SRF.

Again to get this plot you need to supply the realisation file via the --realisation-ffp flag.
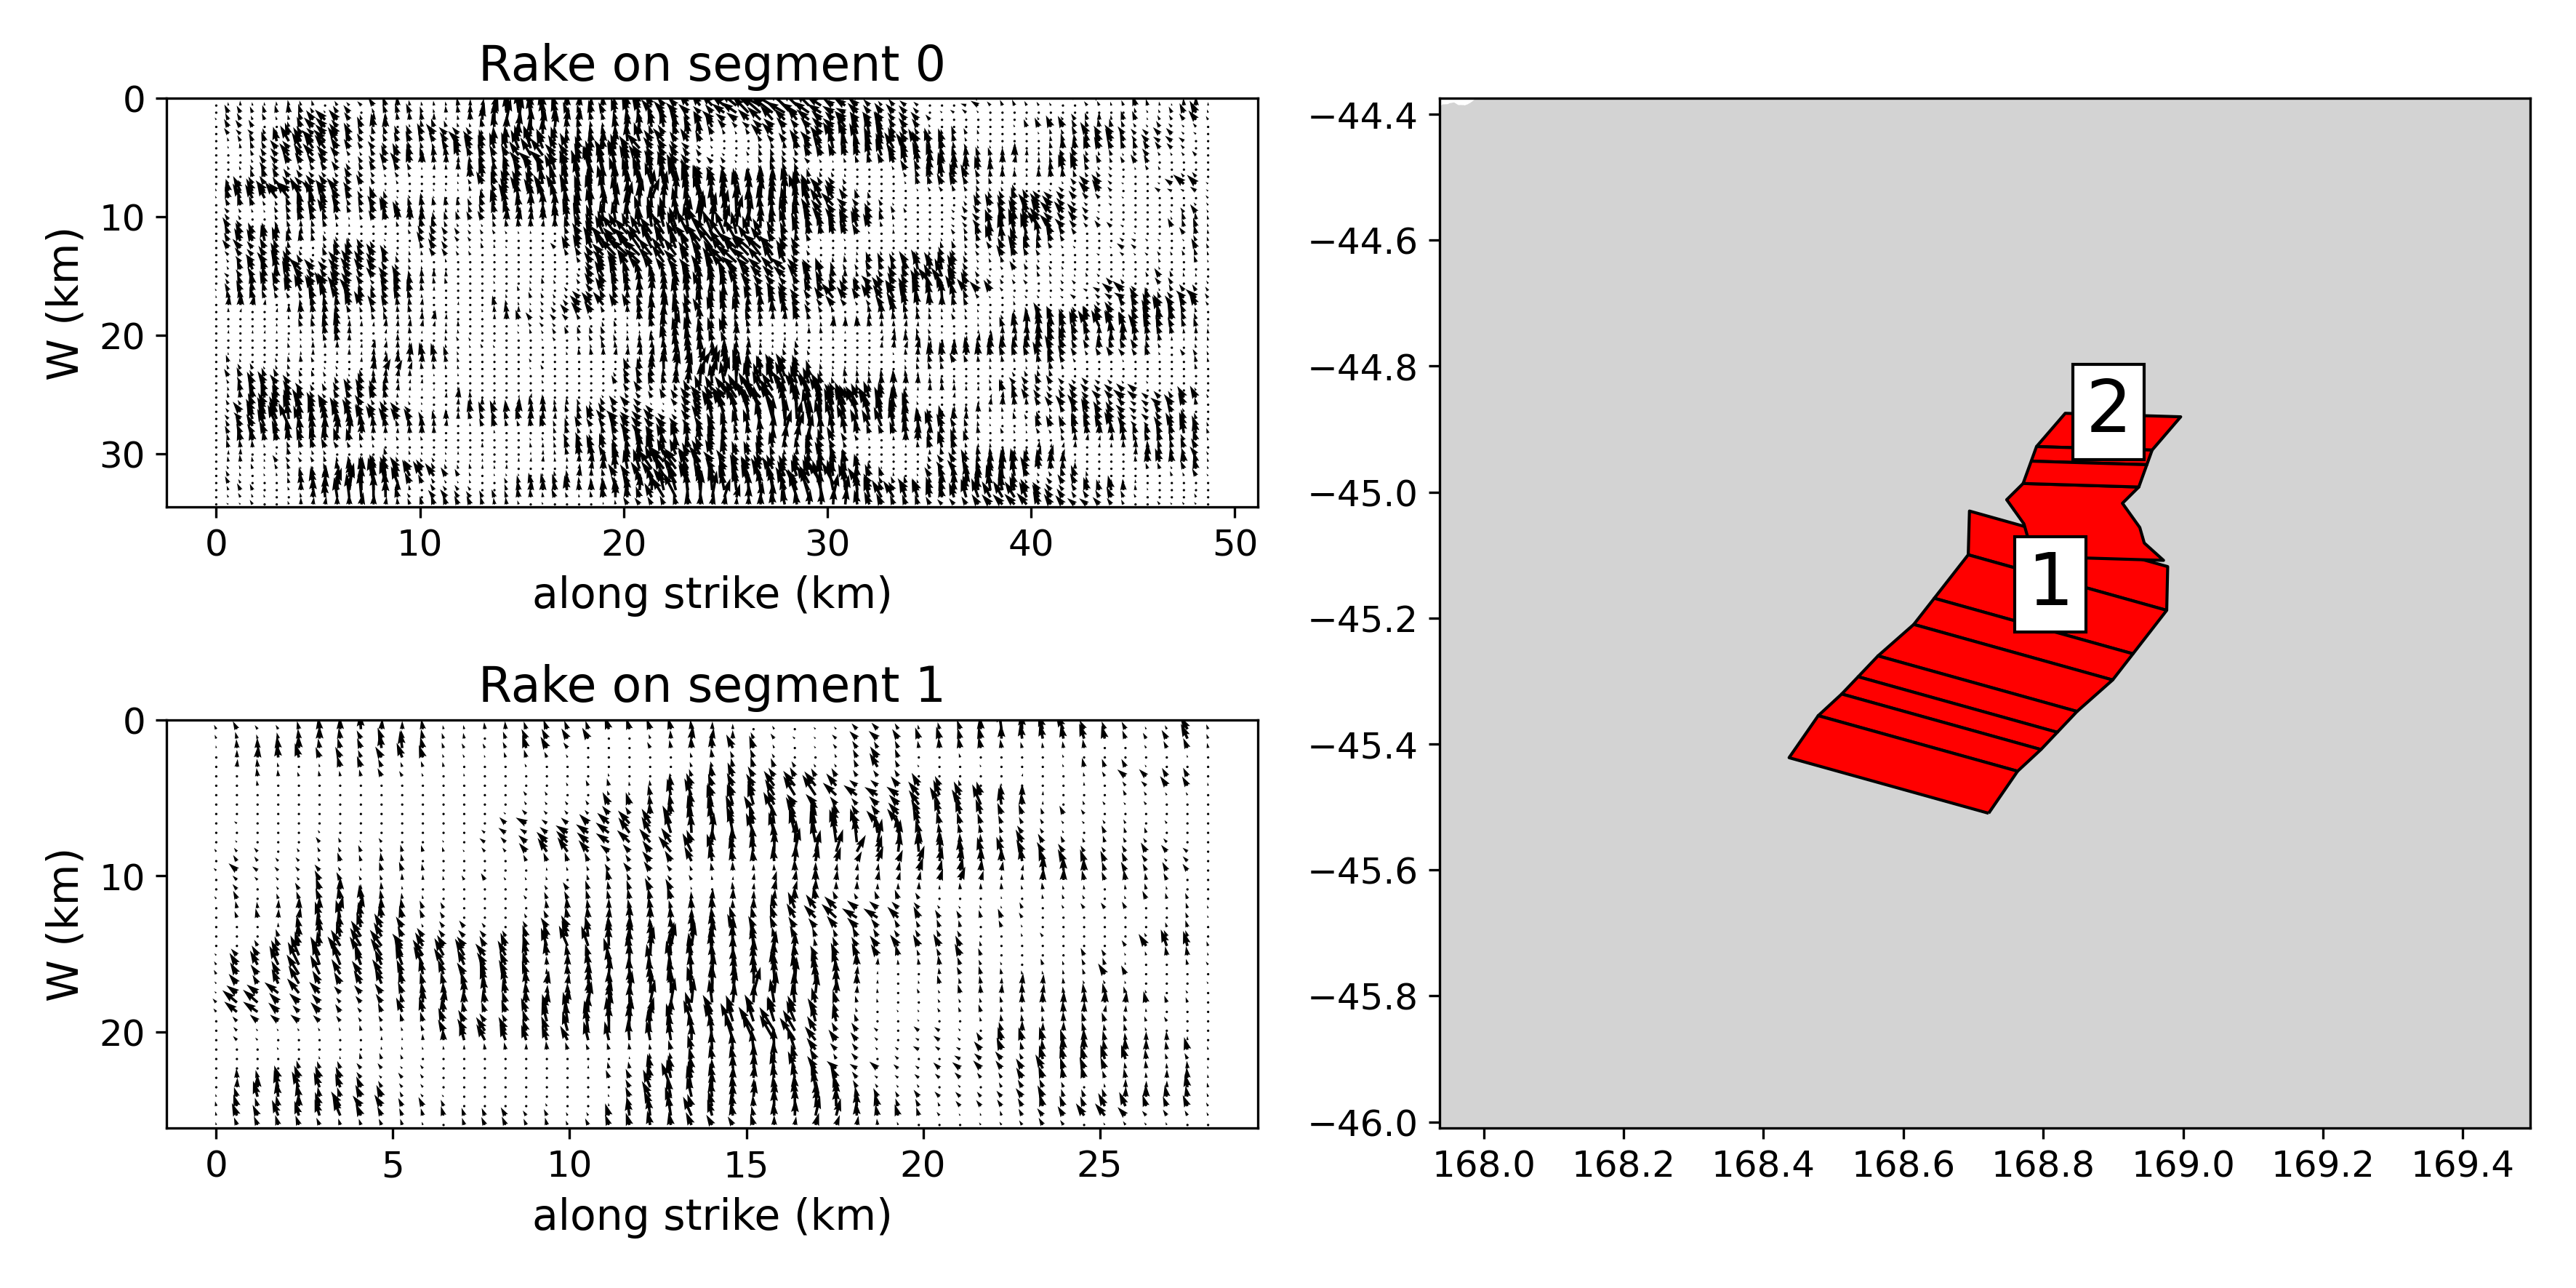
To plot the rake of an SRF, use the plot-srf-rakes command. This
will sample the rake values for points across the SRF and make a plot
of the vectors along each segment.
$ plot-srf-rakes SRF_FFP OUTPUT_PLOT_FFP
You may want to play around with the --sample-size flag to increase the density of the sample rakes.
You should use the plot-srf-rise command. This will plot the rise times for each point with one second contours.
plot-srf-rise SRF_FFP OUTPUT_PLOT_FFP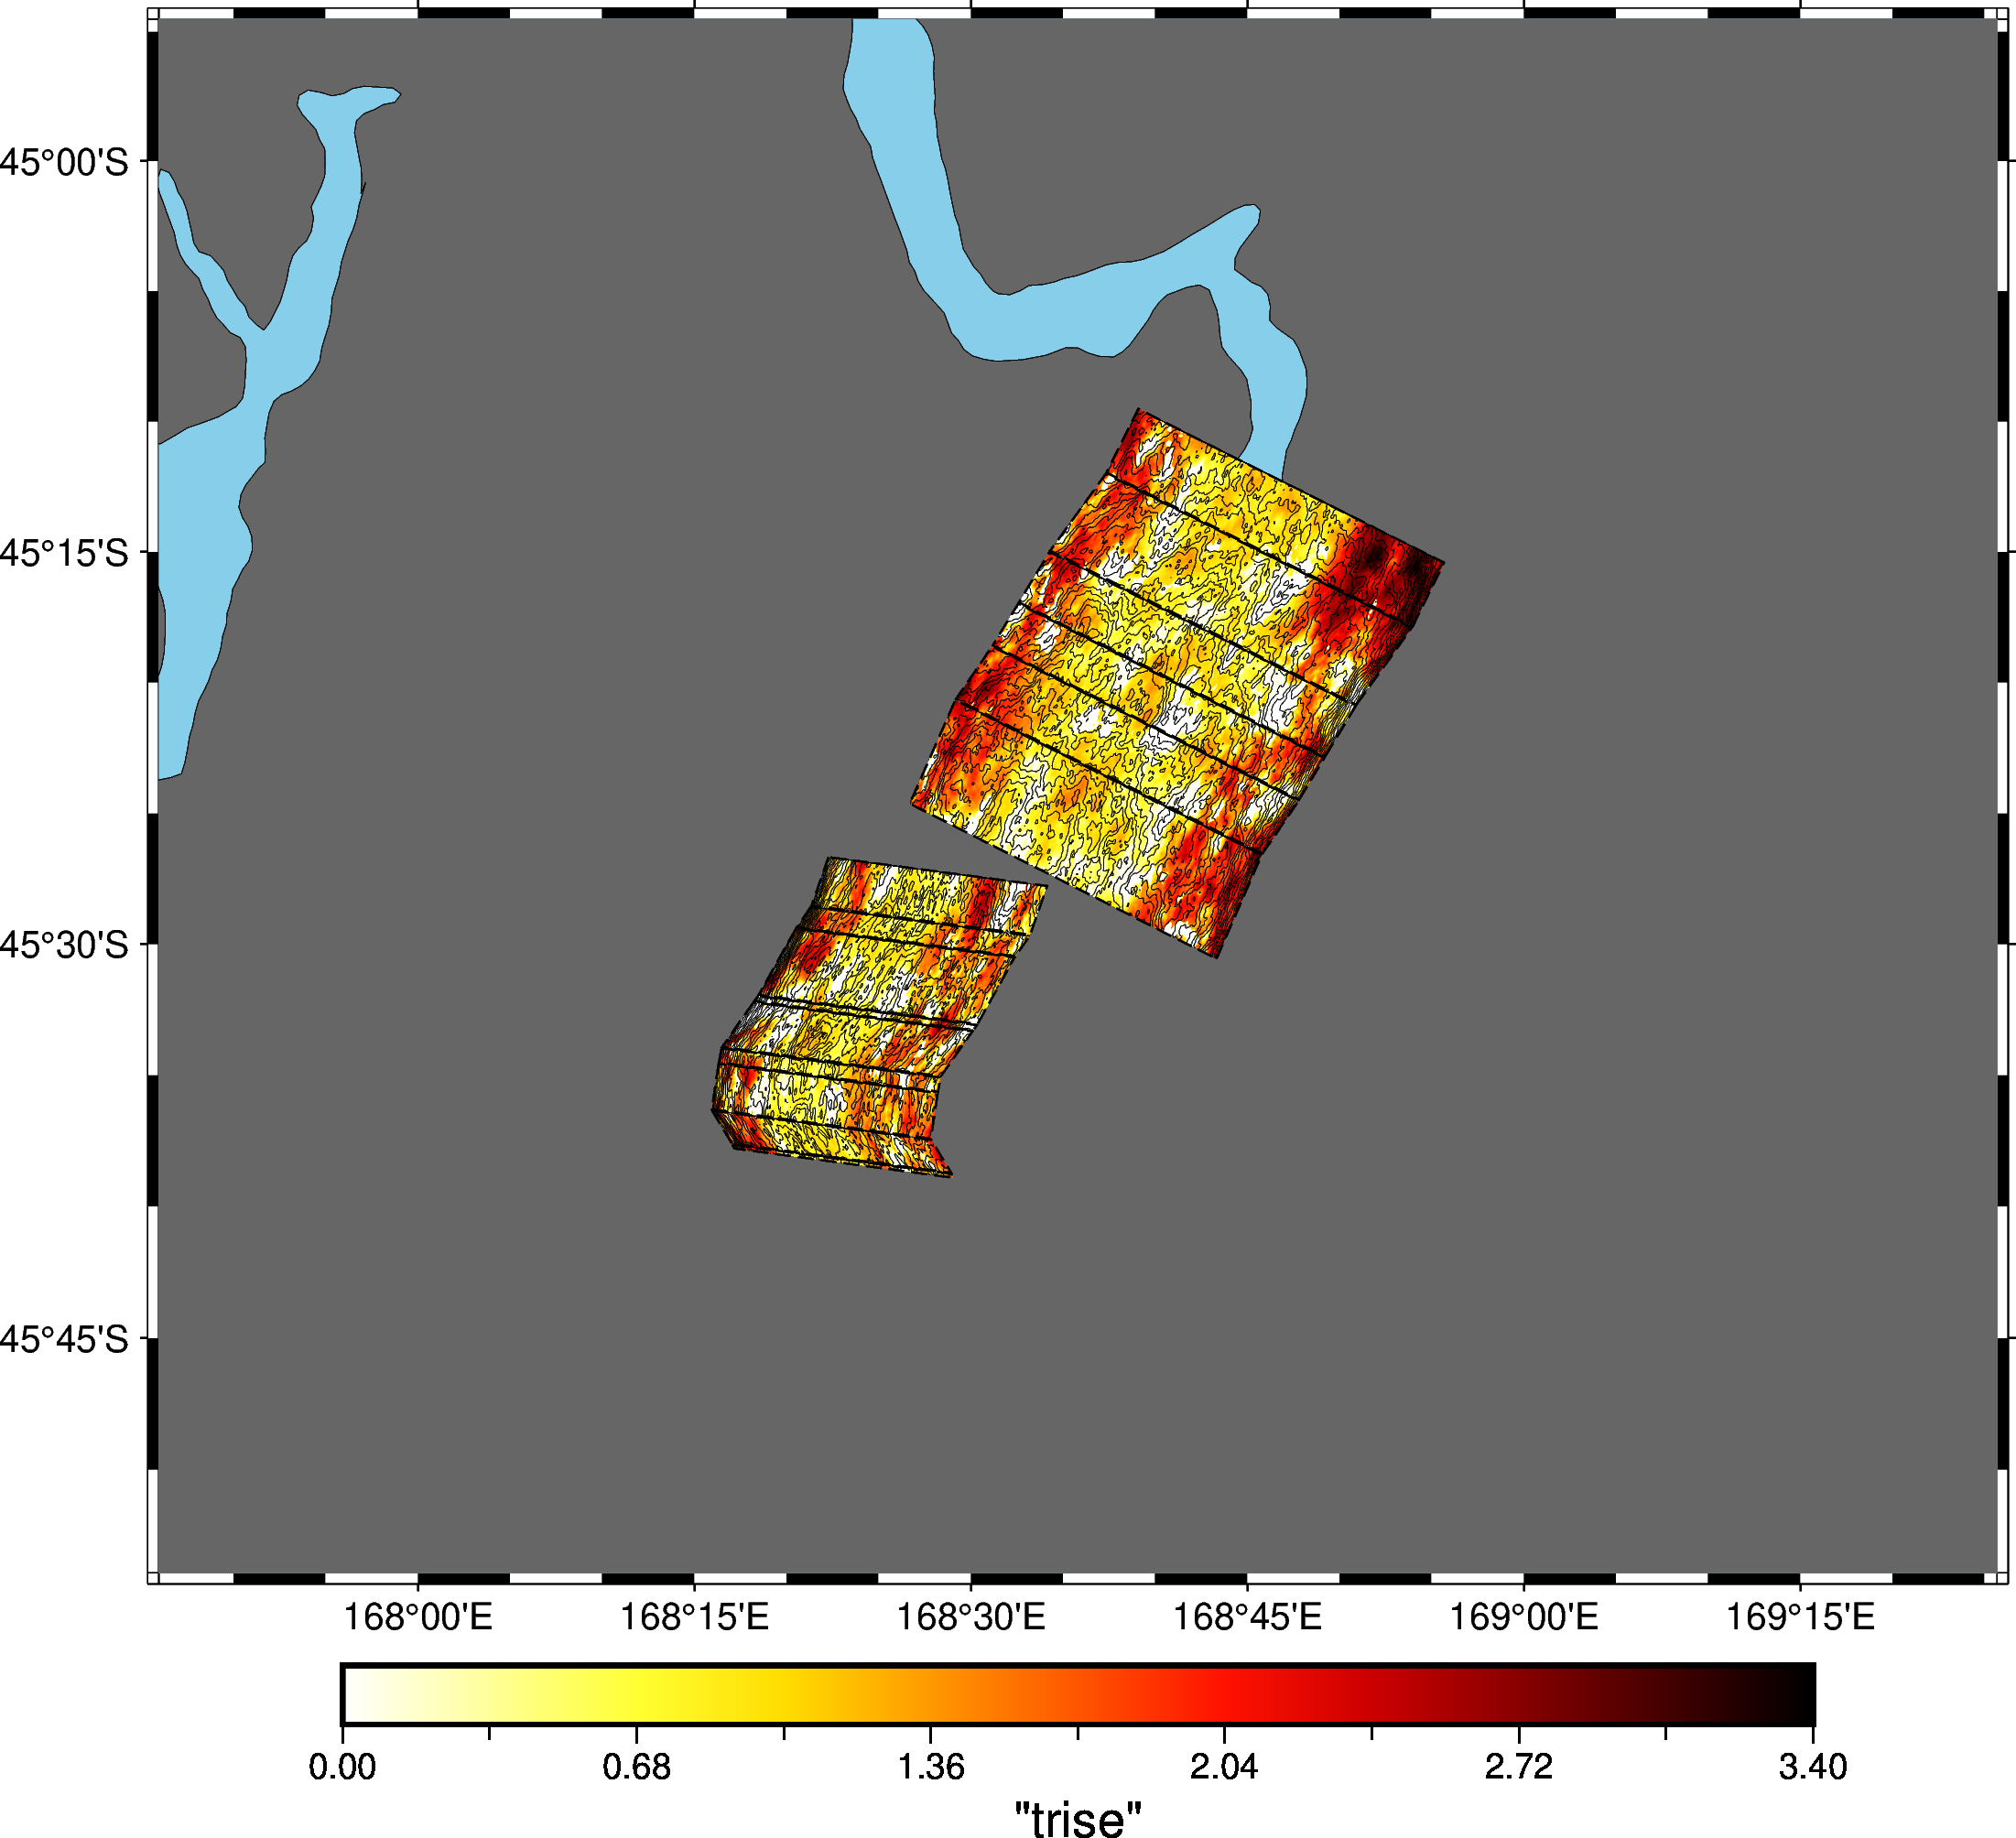
If you want to plot the magnitude of a rupture against the magnitude
on each segment, use the plot-mw-contributions command.
Note
To use this command, you must have a realisation along with the SRF.
plot-mw-contributions SRF_FFP REALISATION_FFP OUTPUT_PLOT_FFP
To recreate the plots from old papers with new code. Then you want to use plot-slip-rise-rake with the --segment parameter to specify the segment of the SRF to plot. For single-segment ruptures you can just pass --segment 1. It is recommended to set width smaller than height because this is a tall plot.
Note
To use this command, you must have a realisation along with the SRF.
plot-slip-rise-rake realisation.json realisation.srf plot.png --segment 1 --width 15 --height 30
You want to use plot-slip-rise-rake. It is recommended to set width larger than height because this is a wide plot. You should make this plot very big.
Note
To use this command, you must have a realisation along with the SRF.
plot-slip-rise-rake realisation.json realisation.srf plot.png --width 200 --height 100 --plot_type PLOT_TYPEThe option --plot_type PLOT_TYPE controls what you to plot based on PLOT_TYPE.