2. shinyApp client
This is an installation manual for Ubuntu server.
- Edit file
/etc/apt/sources.liston the server to include the latest link to update CRAN:
sudo nano /etc/apt/sources.list
Manually check your Ubuntu version using lsb_release -a to decide which link should be inserted, for example, this is a link for Ubuntu 18.04 bionic:
deb https://cloud.r-project.org/bin/linux/ubuntu bionic-cran40/
Press Ctrl+O > Enter to save the file, then press Ctrl+X to exit nano editor.
- Update apt and install R
sudo apt-get update
During updating some machines will report errors such as missing key 51716619E084DAB9, to obtain the key please use:
sudo apt-key adv --keyserver keyserver.ubuntu.com --recv-keys 51716619E084DAB9
Then update again and install R
sudo apt-get update
sudo apt-get install r-base
- Install shiny server following guidance from https://rstudio.com/products/shiny/download-server/ubuntu/
sudo su - \
-c "R -e \"install.packages('shiny', repos='https://cran.rstudio.com/')\""
sudo apt-get install gdebi-core
wget https://download3.rstudio.org/ubuntu-14.04/x86_64/shiny-server-1.5.13.944-amd64.deb
sudo gdebi shiny-server-1.5.13.944-amd64.deb
After installing shiny server, download file app.R and folder www on this GitHub and put it into /srv/shiny-server/MethPanel with a structure as follows:
/srv/shiny-server/MethPanel
    |-- app.R
    |-- www
        |-- full_read.png
Edit file /srv/shiny-server/MethPanel/app.R (file app.R on this GitHub) as follows:
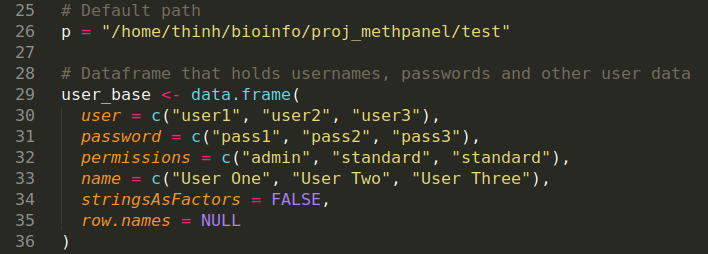
- Edit
/path/to/upstream/analysisto match your upstream analysis folder - Manually create password for each user, username must be the same as the
/path/to/upstream/analysis/<user>
The shinyApp client of MethPanel consists of a login page and 7 component tabs:
Login page: You are required to login with your username and password here for secure sharing data with your collaborators.
1. Trimmed FASTQ QC: You can view quality control metrics and download quality control reports of your sample of interest or all samples here.
2. Alignment: You can select any alignment metric to visualize here and download a table comprised of all metrics. You can also annotate the groups of your samples and visualize these metrics by group.
3. DNA methylation: This tab allows you to discover DNA methylation levels of your samples and amplicons with a variety of options. You can also annotate the groups of your samples and make comparison among your groups, p-value of two-sided t test are provided.
4. Pattern: The pattern of amplicons are displayed here, you are free to zoom in the interactive plots to investigate them in more details.
5. Epipolymorphism: The relationship between epipolymorphism score and methylation level is plotted here.
6. PCR bias correction: MethPanel allows you to perform PCR bias correction if your experiment was conducted with control spike-in samples. The correction can be performed on amplicon or CpG site resolution.
7. DNA methylation after correction: This tab has the same content as tab 3. DNA methylation, except that the DNA methylation levels here are corrected with the tool in tab 6. PCR bias correction.