An app I had created for Telegram March and April Coding Competition.
Since there were significant time restrictions the code is not clean and contains workarounds here at there to cut off the edges.
- Parse .json data and map to custom DataChart struct.
- Load the TableViewController and map DataCharts to DataChartContainers with current trim range state and hidden chart columns.
- Configure TableViewCells with charts. They construct the corresponding ChartView subclasses and push them into view containers.
- Sync events from trimmer view to chart views via the controller.
Goal:
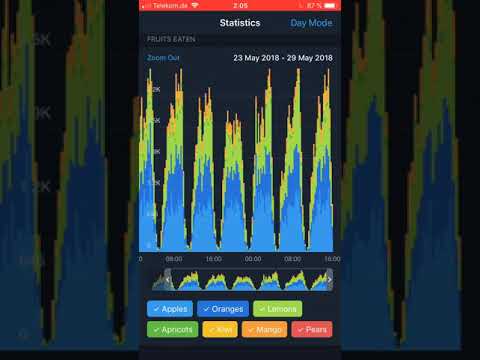
Develop software for showing simple charts based on input data Telegram had provided.
Unfortunately, I did not win any prize here.
Feedback from Telegram:
Unfortunately, your app doesn't fully comply with the design guidelines provided for the contest. Switching to the night mode causes the header and scroll bar to blink. Applying filters to graphs produces incorrect values, dates tend to collide when scrolling. Please note that the task was to place all the graphs on one page.
Goal:
Build 5 graphs based on the input data Telegram had provided. In addition to line charts developed in Stage 1, they had invited developers to support 3 new chart types: line charts with 2 Y axes, bar charts and percentage stacked area charts. Those who aimed for the first prize had to also support the zoom in / zoom out feature and pie charts. Zooming in allows to expand each data point into another graph with a more detailed X-axis. For example, each point on a 365-day daily graph can be zoomed into a 24-hour graph on a 168-hour timeline.
Took 4th place here. My entry.
Feedback from Telegram and public testers:
- Graphs are too large and take almost all of the screen height.
- Lines are rescaled only on tap release when changing time range.
- Average speed.
- Problems with pie chart, since I did not have enough time to finish it. No tooltip, no amination and non-magnetic range selector.
- Initial release for March Stage: "release_march"
- Release for April Stage: "final_version"
- Additional release for March Stage, where old charts would be displayed with the new code base from April: "march_charts_with_latest_changes"