Shehnaz Begum Shaik
Harikiran Madishetti
Card fraud is a term used for theft and fraud committed using a payment card, such as debit or credit card as a fraudulent source of funds in the transaction. Technologies have existed since the early 1990s to detect potential fraud. With the help of machine learning we can find the pattern of usual and unusual behavior of client’s transaction to block likely frauds. This project is based on Kaggle competition conducted by IEEE Computational Intelligence Society (IEEE-CIS) to predict whether a transaction is fraudulent. IEEE-CIS works across a variety of AI and ML areas, including deep neural networks, fuzzy systems, evolutionary computation, and swarm intelligence. In this competition they have partnered with the world’s leading payment service company, Vesta Corporation, seeking the best solutions for fraud prevention industry. The goal of this project is to understand the vast features in the dataset and select the features that contribute most to the target variable. For classification problems like fraud detection Decision-tree based Boosting Algorithm work best. Light Gradient Boosting algorithm was the compiled with AUC test validation score of 0.92. The benchmark score from Kaggle i.e., 0.945 helped us compare the models to choose the most efficient one.
The dataset is provided by Vesta corporation and it is composed of two files identity and transaction, which are joined by TransactionID. Together there are 434 Features, and the objective is predicting the probability that an online transaction is fraudulent, as denoted by the binary target ‘isFraud’. To reduce the features, we have extensively utilized exploratory data analysis followed by data preparation for modeling, where missing value handling, feature selection and feature transformation was done. This has enabled to reduce the number of features from 434 to 189. After selecting the best model, we used it to predict the test dataset and uploaded the submission to Kaggle and obtained a score of 0.9156 (AUC) at the Kaggle private leader board.
The objective of this project is to improve the efficiency of detecting the fraudulent transaction, i.e., to predict by probability whether a transaction is fraudulent. The data comes from Vesta's real-world e-commerce transactions and contains a wide range of features from device type to product features.
This report is based on a Kaggle competition to predict fraud from customer transactions 3. The researchers from IEEE-CIS started this competition to improve the fraud preventing system that can save consumers their hard-earned money. IEEE-CIS works across variety of AI and ML areas seeking the best solutions for fraud prevention industry. The data set comes from vesta corporation, an industrial leader in fraud detection.
The data provided from Vesta corporation is broken into two files identity and transaction, with a common feature TransactionID. The transaction file contains details like Transaction date, Transaction Amount, Product code, Card 1- 6 (Card information , type etc), Address, distance, purchaser and email, C1 – 14 (Address count associated with each card), D1-D15 (Time delta, time between previous transaction), M1- 9 (Match such as name, address etc), Vxxx (Vesta features such as ranking, counting, etc) The Identity file contains details like identity information – network connection information (IP, ISP, Proxy, etc) and digital signature (UA/browser/os/version, etc) associated with transactions. They're collected by Vesta’s fraud protection system and digital security partners.
Since there are many columns to understand the data and the variables, we performed some data exploration to understand the features better and primarily to understand what features are critical and contribute to the target variable. The Transaction data table has a total of 394 variables and the identity data table has 41 variables.
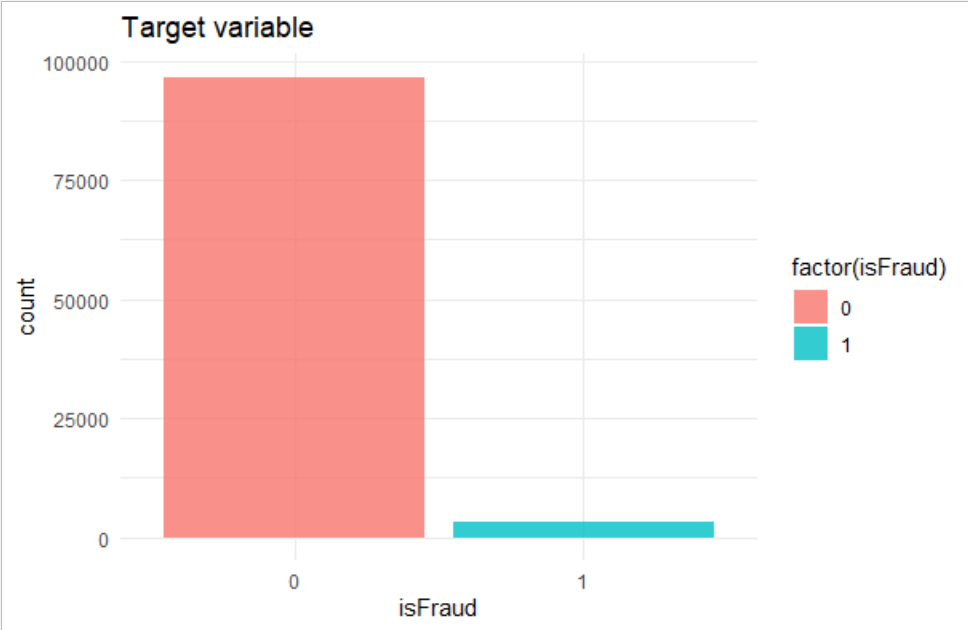
Our first analysis is on the Target Variable “isFraud”. From the below plot generated we can see that the data is imbalanced with respect to the target variable. This could cause under fitting or over fitting of the model.
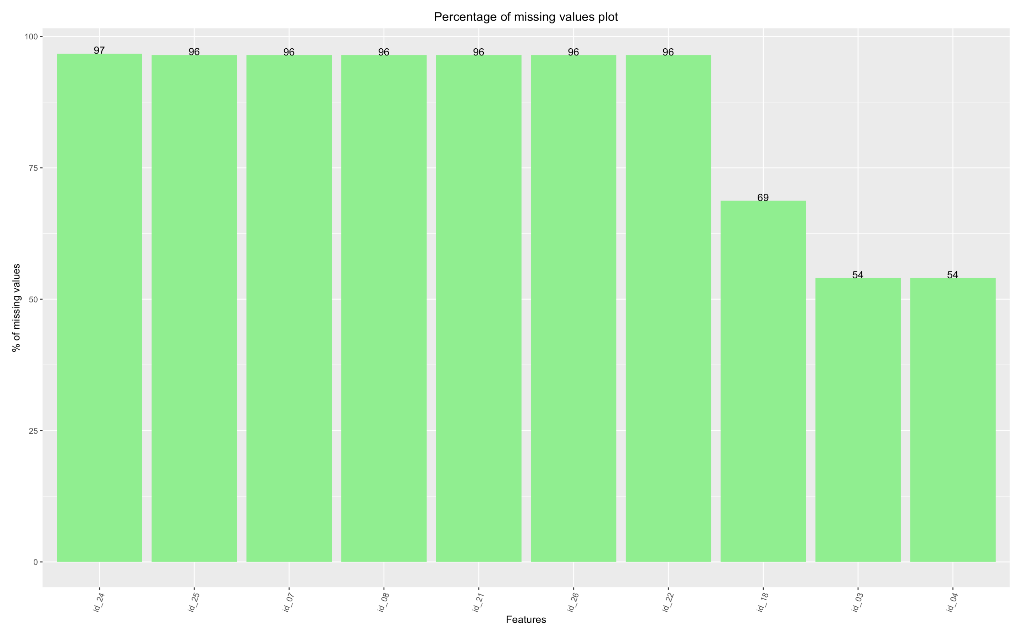
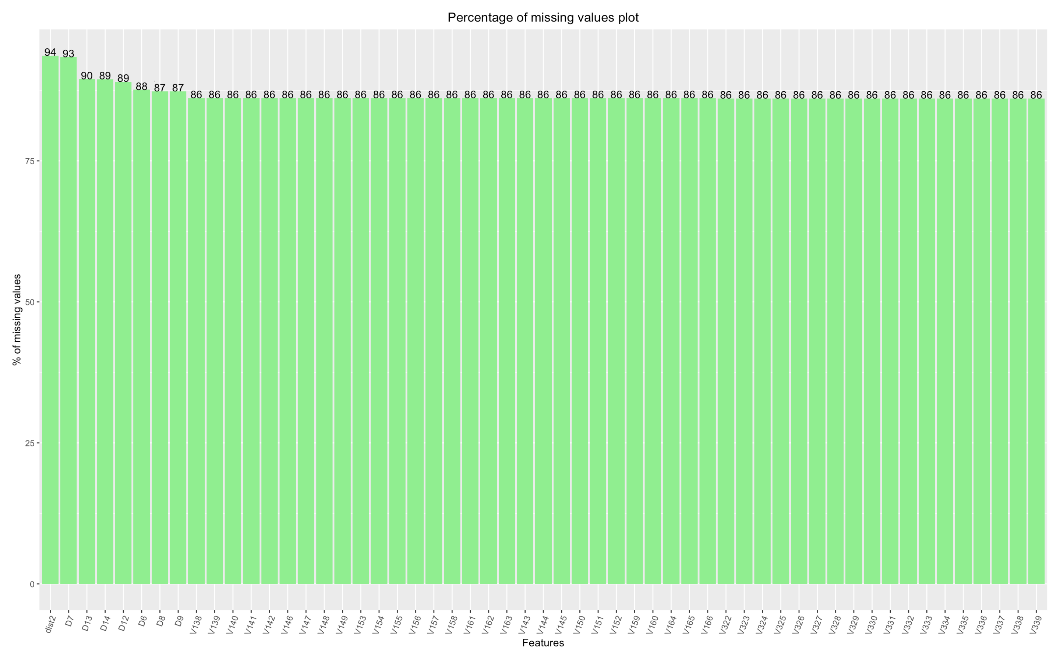
Analyzing the missing data from the Transaction and identity datasets to understand what features are important and contribute to the target variable.
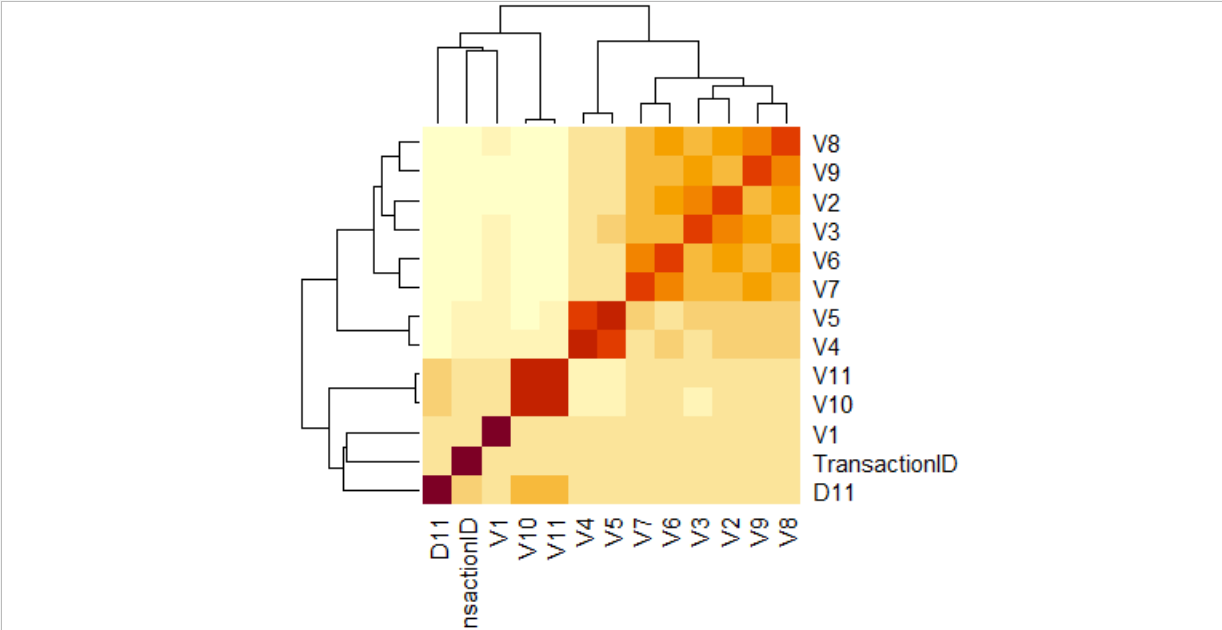
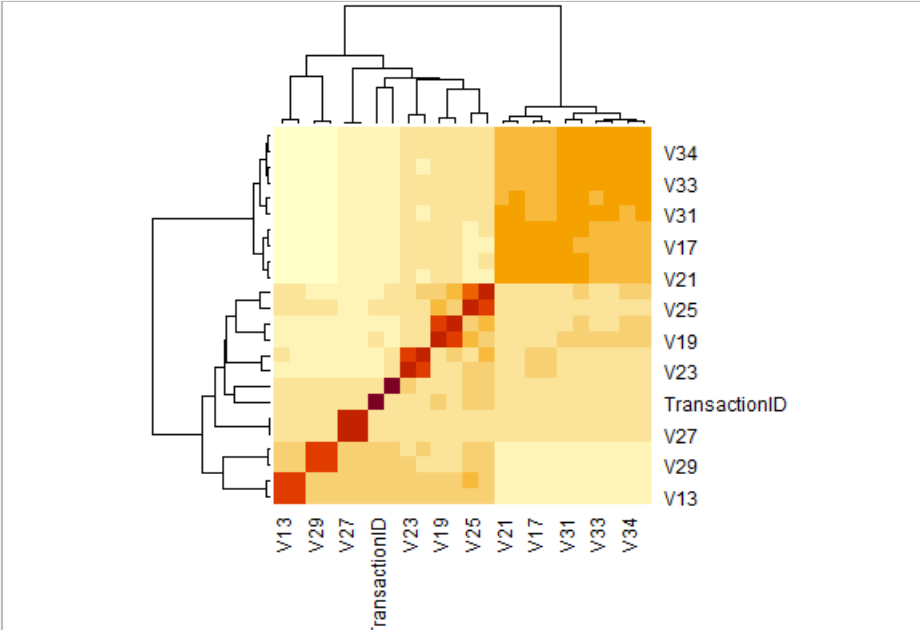
Analyzed correlation between different features, to identify the highly correlated variables. Since we have 434 features in both datasets, it is tedious to identify correlation between all the variables. Hence, we identified the features with similar percentage of missing values from the missingness plots and grouped them together to identify the correlation between them. The below plot is one of the examples of such plots to identify correlation between variables with similar missingness.
The next crucial step in our analysis plan is handling missing values. To achieve this, we checked the missingness percentages of all the features in the datasets and then, dropped the columns that have missingness percentage more than 90%.
Apart from dropping the features with missingness more than 90%, we analyzed the correlation heatmaps produced for different variables to identify the highly correlated variables. And removed one of the variables if two variables are highly correlated. For example, In the first heat map for variables d11, V1 to V11 we can observe that set of variables (V2 ,V3) , (V4 ,V5), (V6, V7), (V7,V8) and so on are highly correlated. So, we dropped one of the variables in each of the above sets that has a smaller number of unique values. Similarly, we applied the same logic to all the other features that are highly correlated. By doing the above we were able to reduce the total number of features to 189. We also identified that transaction id is not of significance with respect to the target variable and hence, we removed that feature.
In this stage, we have used stratified imputation method which is based on single value imputation method, where we grouped the features based on condition and replaced continuous variables with mean and replaced the categorical variables with mode for each group.
The primary feature we considered for transformation is Transaction date. It is in the form of seconds with a starting value is 86,400 and a maximum value is 1,58,11,131. We have transformed this data by dividing it with 86,400. Due to this the scale of this feature reduced to 1 to 183. Another important feature we transformed is Transaction amount for which we have used log transformation.
At this point we have identified the features that contribute most to the target variable “isFraud” which have now reduced from 434 to 189. Hence to predict whether the transaction is fraudulent we have used Decision-tree based Boosting Algorithm. Gradient Boosting Algorithm (GBM) can be used for both classification and regression problems. It produces the models like that of a decision tree. This is most desirable approach since we have categorical features with multiple factors in the dataset which makes it difficult for certain algorithms to perform better. Light GBM has a built-in option to treat columns as categorical and handle missing values efficiently. Hence, we have used Light GBM which is a framework developed by Microsoft to implement boosting algorithms. Unlike other decision tree based boosting algorithms which grows tress depth wise4, Light GBM grows leaf wise. This may cause over fitting in case of small datasets. This over fitting problem can be handled by maximum depth of a tree hyper parameter. Another advantage is that Light GBM automatically parallelize the process of model training. It also efficiently uses GPU to reduce the training speed of the model. This also supports multiple validation metrics like, Logloss, AUC and accuracy, Classification error rate. It also has a built-in module for cross validation which can be used to evaluate a model’s performance. For modeling we are using only the training dataset from Kaggle to evaluate as we have target variable only in training dataset. We have split 80% of data to train and 20% of data for validation. Using the K fold cross validation, we have selected the best model (evaluation metric: AUC) and then predicted the fraudulent transaction using the best model selected.
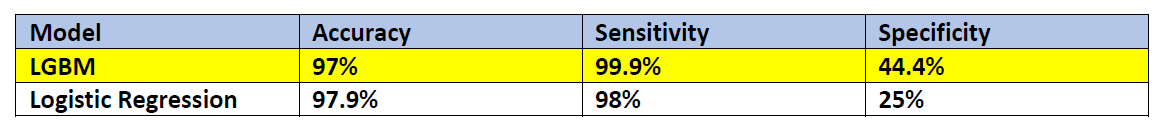
From the above table, Accuracy of Logistic regression is almost like that of LGBM. However, the specificity is 25% which means that it predicts a fraudulent transaction as fraudulent correctly 25% of the time, which is very less compared to the specificity of LGBM. Hence, we have selected LGBM model for evaluation and Kaggle competition submission.
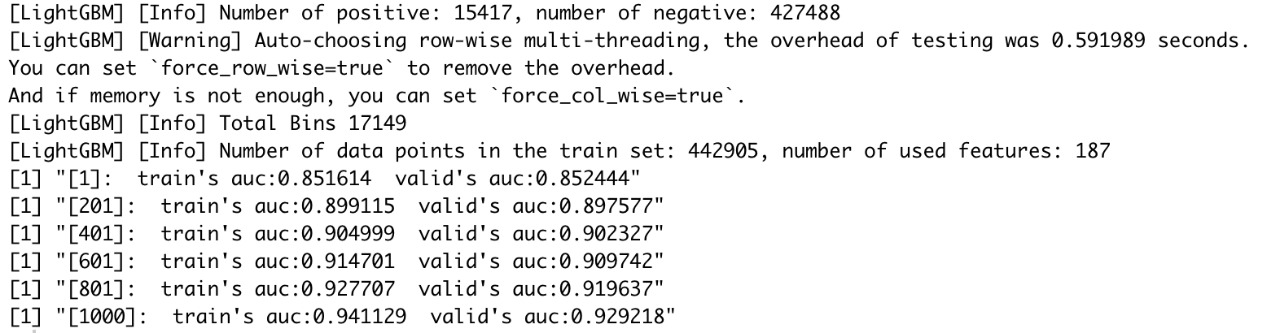
The above results are obtained from data trained on 80% of train data and validated against 20% of the remaining data. From the above screenshot we can say that the AUC of the model after 1000 training rounds is 94.11% for training dataset and 92.92% for validation dataset.
To evaluate the model, we have predicted the dataset using the best model selected from above and compared it with the Target variable, isFraud.
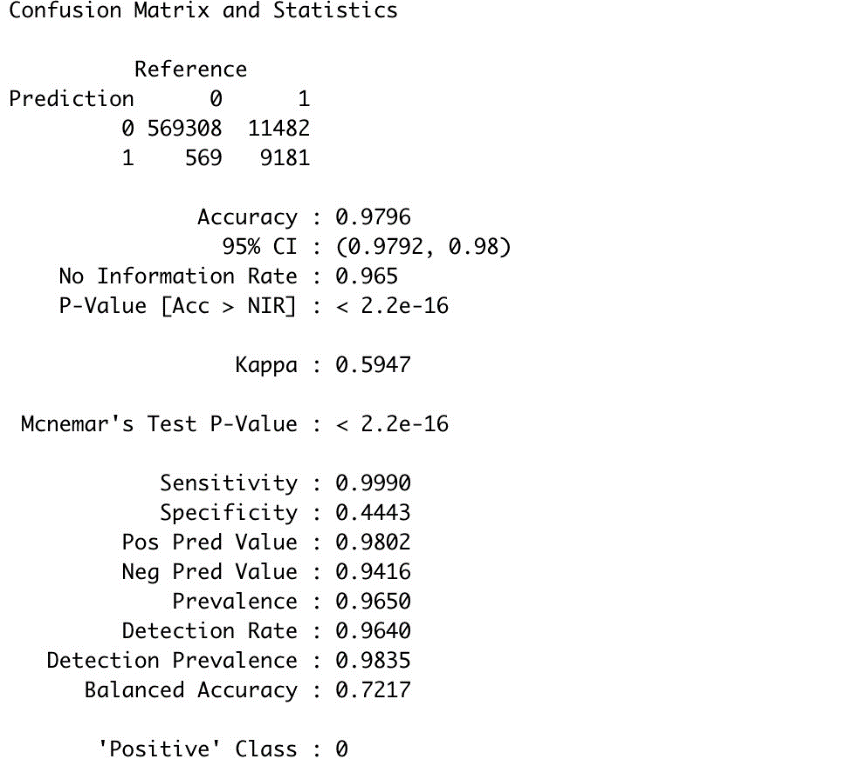
From the above confusion matrix statistics, we can observe that accuracy of our model in predicting the test dataset is 97.9%. From sensitivity we can observe that our model has detected the transactions which are not fraudulent 99.99% of the time correctly. And the transactions which are fraud are detected as Fraud 44.4% of the time.
Evaluating the performance of the model.

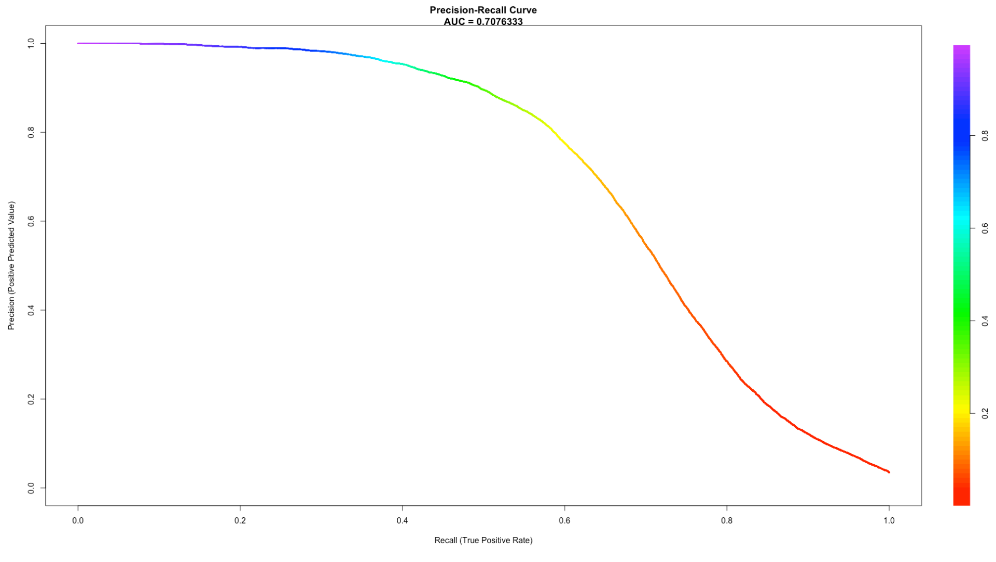
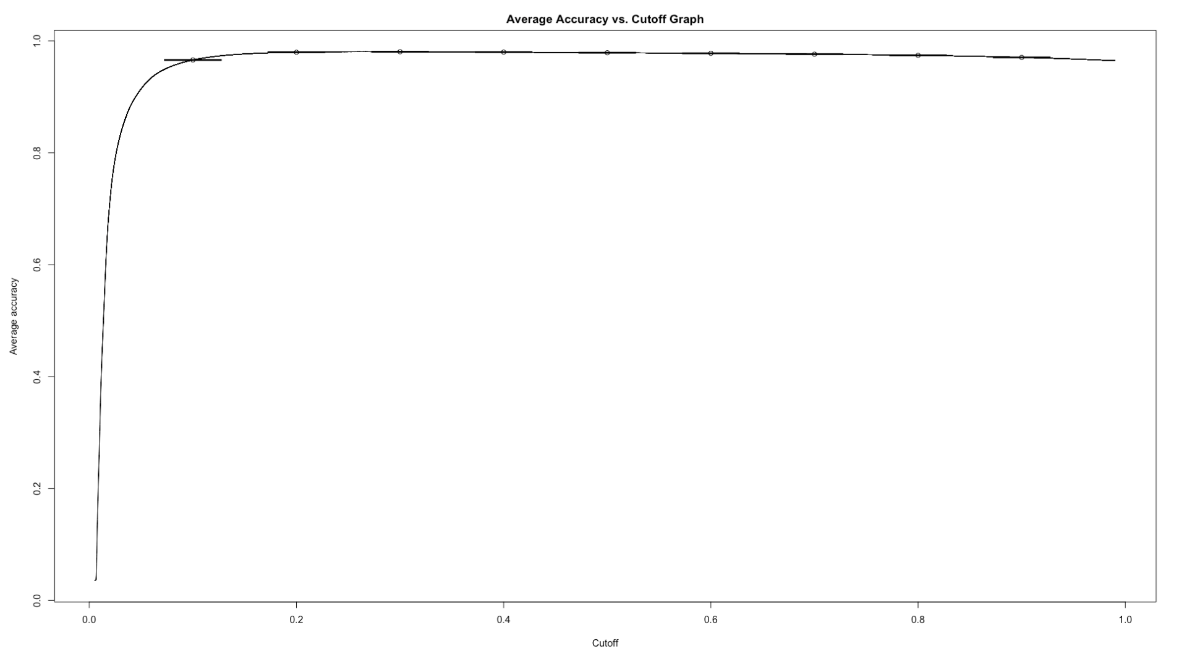
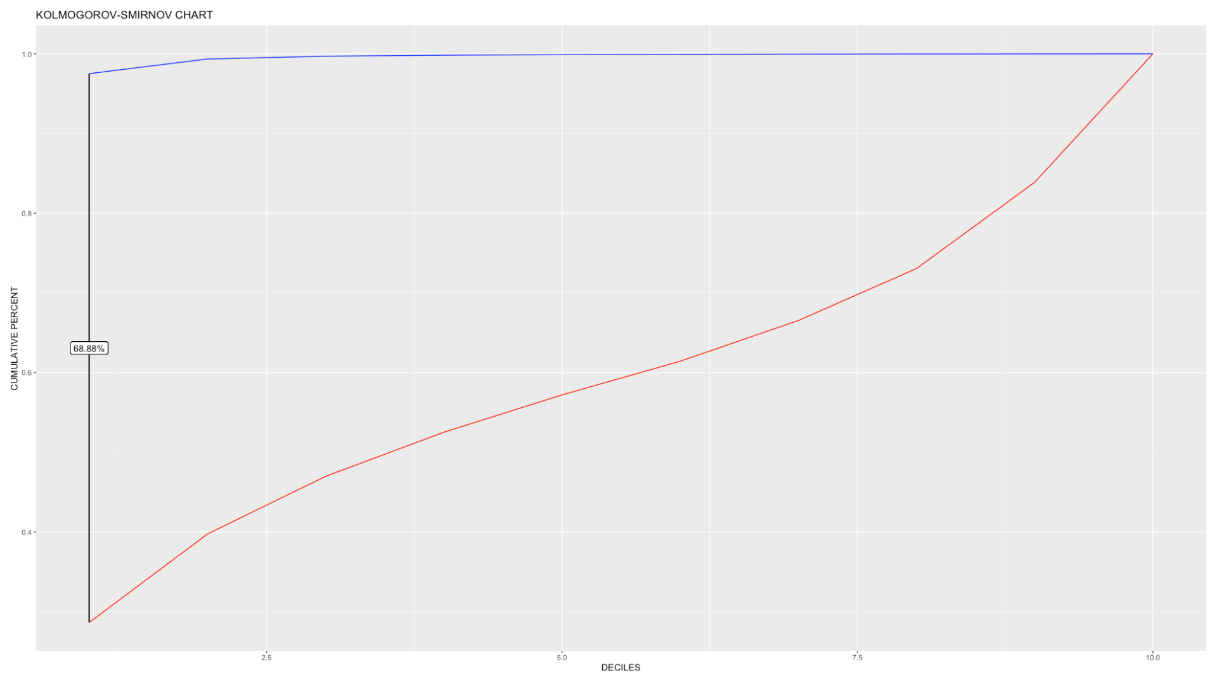
From the above evaluation metrics, we can see that the accuracy of the model is 97.9%. From the ROC curve we can see that the area under the curve is 93.29%. The K-S statistics infers that a fair amount of 68.88% of data can be easily classified into different categories or classes.
The below is the snapshot of submission of our model result to the Kaggle competition. From the picture we can see that our model scored 0.9156 in the private leaderboard.
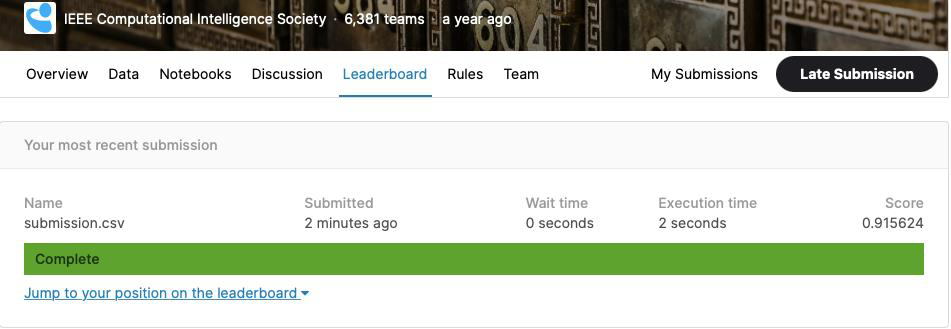
Overall, two models were built and tested with each feature. It was observed that using selected features was applied to the training dataset, which resulted in accuracy of 97.9%, specificity of 44.4%, and AOC of 93.29% for our LGBM model. Using this model, we predicted the test dataset of Kaggle, which resulted in AUC score of 0.9156 in the competition’s private leaderboard.
In classification problems, balancing your data is absolutely crucial, since data imbalance can create bias in prediction. To handle data imbalance SMOTE, a very popular oversampling method that was proposed to improve random oversampling. The specificity (True Negative) of our model is 44.44%, which means the model predicts s fraudulent transaction as fraudulent 44.44% of the time, which needs to be improved by further fine tuning the parameters for efficient prediction.
References:
- https://www.bloomberg.com/press-releases/2019-12-23/smartmetric-reports-that-over-24-billion-was-lost-in-2018-due-to-payment-card-fraud-worldwide
- https://nilsonreport.com/the_nilson_report_in_the_news.php
- https://www.kaggle.com/c/ieee-fraud-detection/data
- https://www.analyticsvidhya.com/blog/2017/06/which-algorithm-takes-the-crown-light-gbm-vs-xgboost/