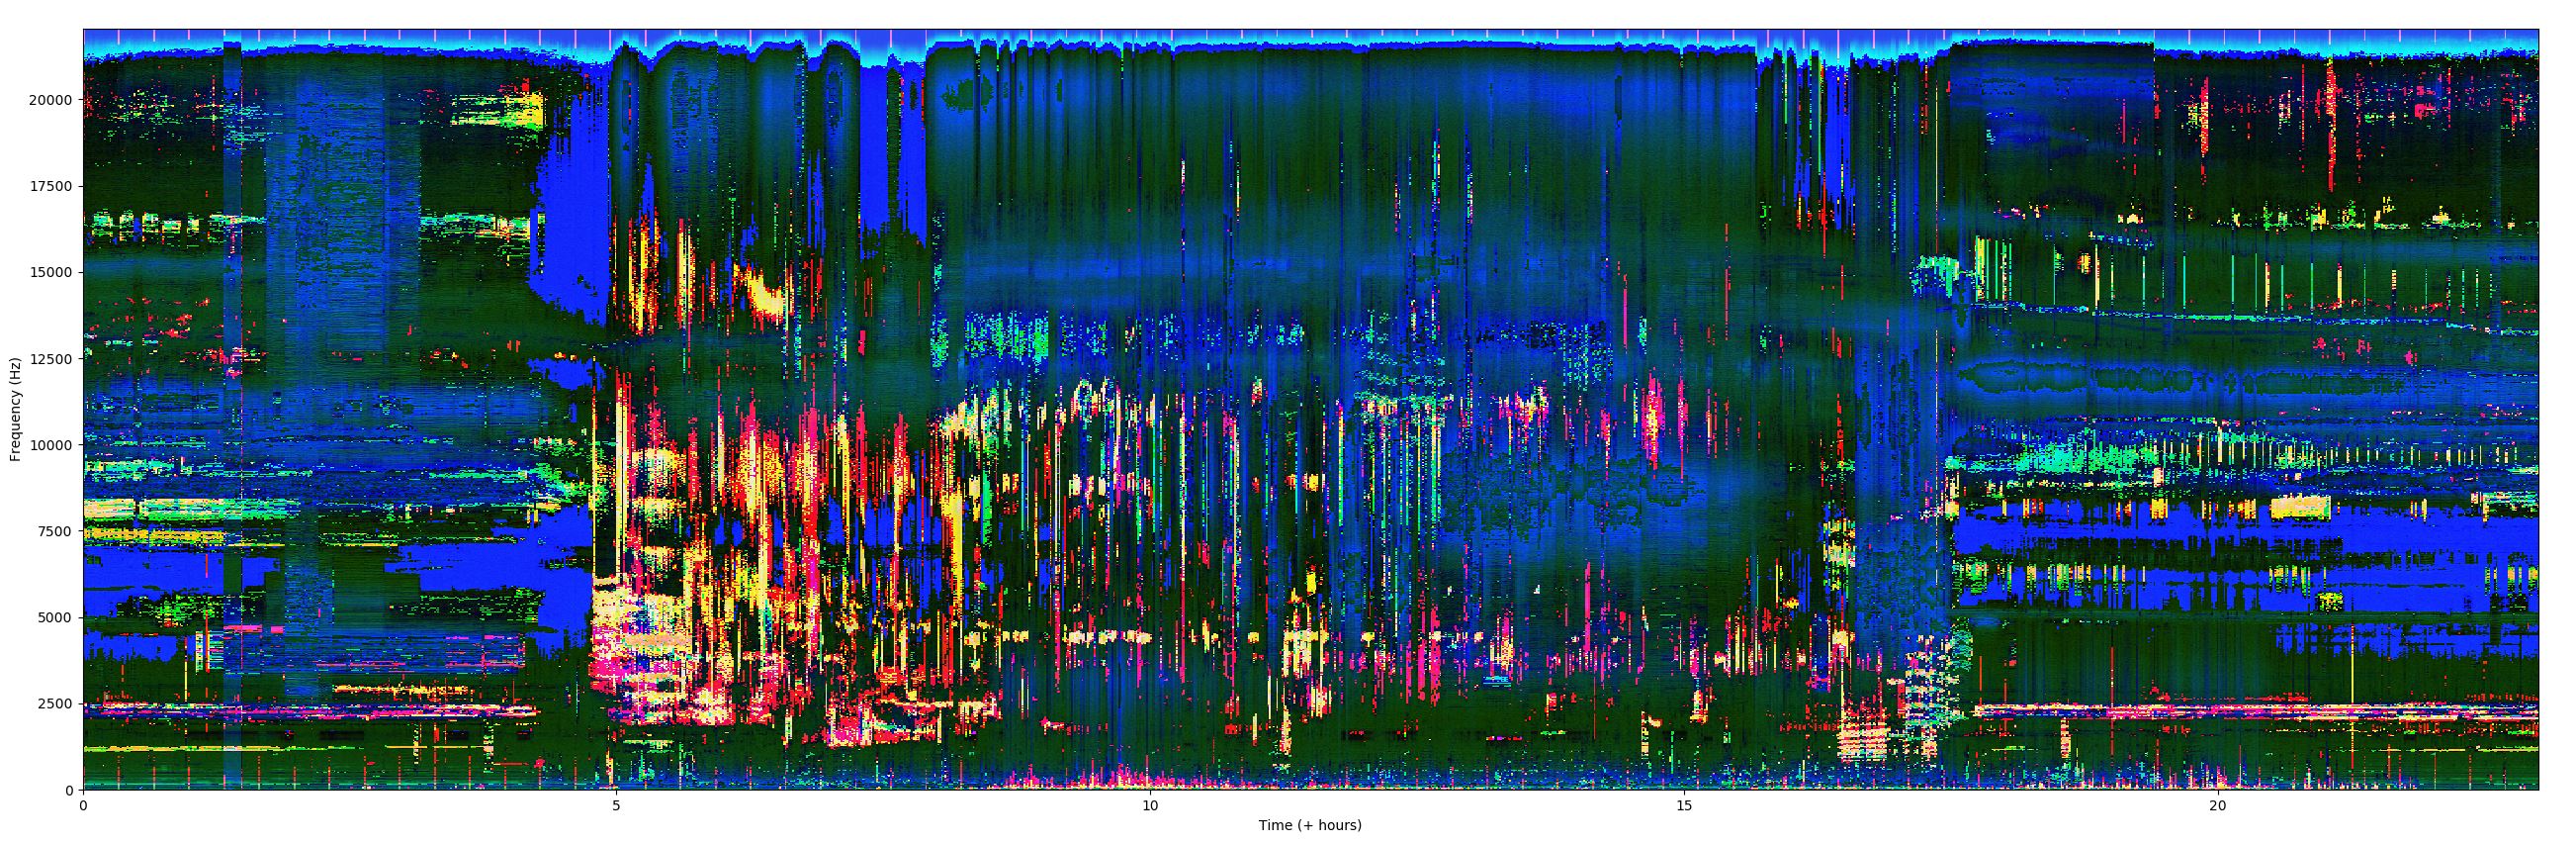
Generate a false colour index spectrogram to visualise long duration soundscape recordings - based on Towsey et. al. 2014
Code tested using Python 3.12 on a 6 core Intel i7 Macbook Pro at 2.6 GHz and 14 core M3 max running MaxOS 14.4.
Install miniconda or miniforge.
Clone the repository and open the cloned folder in a terminal. The environment can be created using;
conda env create -f environment.yml
activate the newly created environment using:
conda activate false_colour_index
The code is designed to process 24 hours of audio. If this audio is placed in multiple files in the ./input_audio folder use the following command to show and save the false colour spectrograph.
python calculate_index_spectrograms.py
If you need to process many sets of 24 hours, create folders and create a batch task pointing the script at each 24 hour folder:
python calculate_index_spectrograms.py -i /path/to/your/folder1
python calculate_index_spectrograms.py -i /path/to/your/folder2
python calculate_index_spectrograms.py -i /path/to/your/folder3
python calculate_index_spectrograms.py -i /path/to/your/folder4
calculate_index_spectrograms.py contains the main functions which can be used in your own Python scripts if you import the file as a module. When using the file as a script, you can optionally change the input/output paths and you can also disable re-calculation of the statistics: run python calculate_index_spectrograms.py -h for information about the command-line options.
- Select which indices to calculate by adding 3 function names in list
indices_to_calc. Currently available are:fentropy,aci,magsumandspecpow. - Move audio files to analyse to the ./input_audio folder or use
-icommand line argument to point to another location. - All audio files in the target folder will be combined into a single false-colour spectrogram.
- Ensure that the naming scheme used for audio files results in consecutive files when sorted in alphabetically by name.
- Assumes zero gap between input audio files. Any gaps between files will not be taken into account so use continuous data for each job.
- The false-colour spectrogram will be saved using
yyyy-mm-dd_HHMM_false-colour-plot.pngby default. This can be changed using the--savefargument.
Command line options:
-i, default="./input_audio", "Input path: can be a path to a single file (which will be chunked), or a folder full of wavs, or the input can be a list of wav files which you explicitly specify"-o, default="./default_out", "Output path: a folder (which should exist already) in which data files will be written."-n, default=1, choices=[0,1], "Whether to apply scaling (normalisation) of the statistics before plotting them."--savef, default='YYYY-MM-DD_HHMM_false_colour_plot.png', "Image file where the output figure should be saved (including extension (png, jpg, etc.). Expect issues with vector graphics")--hop, default=100, "How much gap between 'window', as a percentage of window size. Default of 100 %% is recommended for long >2hr. For 1hr audio you could try 25 %% for finer resolution."--fmin, default=0, "Lowest frequency (in Hz) to show on the plot."--fmax, default=44100, "Highest frequency (in Hz) to show on the plot."
plot_index_distributions.py can be used to look at the distribution of values for each of the three indices
24 hours recorded from a tropical rainforest in Sabah, Borneo. Dawn and dusk choruses are clearly visible with different patterns of calling during the day and night time
Input can be a single long file which will be analysed in 1-minute chunks, OR a folder containing a series of consecutive WAV files.
Long-duration recordings split into multiple WAV files of any length can be handled by this script.
24 hours of audio can be processed on a 14 core M3 with MacOS 14.4 in 31 seconds, pn a 6 core Intel i7 with MacOS 14.4 it takes 120 seconds,
Numpy ndarrays storing individual index spectrograms are stored in ./output_spectrograms/ folder.
- Sarab Sethi (Imperial College London)
- Dan Stowell (Queen Mary University of London)
April 2024
-
- Joshua Taylor (subbed in standard soundfile library and added parallel processing) (Social Environment CIC)
- replaced chunking via modified librosa with block processing from soundfile
- added multiprocessing ability
- run time for 24 hours reduced from 1 hour to 32 seconds with 14-core M3 max
- edit variable names for readability
- runs on Python 3.12
- Joshua Taylor (subbed in standard soundfile library and added parallel processing) (Social Environment CIC)