First version of the meister profiler #561
Conversation
 NitinAgg
left a comment
NitinAgg
left a comment
There was a problem hiding this comment.
Worried about adding this decorator everywhere. Would it be possible to add a visualizer on top of cprofile (context: https://stackoverflow.com/questions/582336/how-can-you-profile-a-python-script)
opta/cli.py
Outdated
| # after the command. | ||
| # However, we should still clean them up before the next command, or | ||
| # else it may interfere with it. | ||
| meister.MEISTER_REPORT_ENABLED = VERSION == DEV_VERSION |
There was a problem hiding this comment.
Might be better to have a separate flag for this
 bigbitbus
left a comment
bigbitbus
left a comment
There was a problem hiding this comment.
We could create another repo for meister under runx and market it as a tool for the community - it will get some traffic to runx (although it will be generic python perf searches rather than IaC only). Who knows, it might just take off!
Codecov Report
@@            Coverage Diff             @@
##             main     #561      +/-   ##
==========================================
+ Coverage   73.15%   73.48%   +0.33%
==========================================
  Files         100      101       +1
  Lines        6678     6973     +295
==========================================
+ Hits         4885     5124     +239
- Misses       1793     1849      +56
Flags with carried forward coverage won't be shown. Click here to find out more.
Continue to review full report at Codecov.
|

|
@NitinAgg believe me, I truly wish you were right, and doing something like that was the first thing I tried. Unfortunately I abandoned that approach because
I agree with you that having it as a decorator in every function is tedious and it was a defeat I'm not happy with, but I couldn't think of a way around it. Obviously there has to be a way to get this, but I was way down the rabbit hole and still no sight of the solution so I cut my losses. I don't think it was a major setback as we could in the end get more succinct, "quick" metadata which we wanted for the purpose of increasing opta's speed. But if you do find a way to simply have a "magic one line that sets it all up" pls pls pls let me knw |
|
@bigbitbus Yes we could, but I want to let it "incubate" a bit in opta to see if it truly is useful. |
 rabbitfang
left a comment
rabbitfang
left a comment
There was a problem hiding this comment.
It's a cool feature. I wonder if we could find a way to automatically annotate functions that opta defines.
Pairing up the function colors with the lanes below might be hard to do. A suggestion would be to print the function's fully qualified name (or part of it; includes module name) inside of the bar graphs in white.
opta/meister.py
Outdated
| MEISTER_START_TIME = time.time() | ||
|
|
||
|
|
||
| def meister_time(func: Callable) -> Callable: |
There was a problem hiding this comment.
So I took a stab at removing all of the duplication of this function, and I was semi-successful, but I don't know if it actually reads better (its also untested):
T = TypeVar('T')
TCallable = TypeVar('TCallable', bound=Callable)
U = TypeVar('U')

def profile(func: TCallable[T, U]) -> TCallable[T, U]:
    def time_func(*args: Any, **kwargs: Any) -> None:
        if not MEISTER_REPORT_ENABLED:
            # Skip over the expensive stack inspection and storing of func args if this isn't enabled
            yield
            return

        frame_info = inspect.stack()[1]
        start_time = time.time()
        yield
        end_time = time.time()
        if end_time - start_time <= MEISTER_TIME_THRESHOLD:
            return

        MEISTER_RECORDS.append(
            {
                "function_name": func.__name__,
                "positional_args": args,
                "keyword_args": kwargs,
                "start_time": start_time,
                "end_time": end_time,
                "id": uuid4(),
                "caller_file": "/".join(frame_info.filename.split("/")[-2:]),
                "caller_line": frame_info.lineno,
            }
        )
        print(
            f"{fg('green')}Meister{attr(0)}: Function {func.__name__} took {end_time - start_time} seconds"
        )

    if iscoroutinefunction(func):
        @wraps(func)
        async def wrapper(*args: Any, **kwargs: Any) -> Any:
            timer = time_func(*args, **kwargs)
            next(timer) # Start timer

            output = await func(*args, **kwargs)

            try:
                next(timer) # Complete the timing
            except StopIteration:
                pass

            return output
    else:
        @wraps(func)
        def wrapper(*args: Any, **kwargs: Any) -> Any:
            timer = time_func(*args, **kwargs)
            next(timer) # Start timer

            output = func(*args, **kwargs)

            try:
                next(timer) # Complete the timing
            except StopIteration:
                pass

            return output


    return wrapper
Used a different function name, so usage changes to (but change in name is unimportant):
from opta import meister

@meister.profile
def foo():
   ...
opta/cli.py
Outdated
| # after the command. | ||
| # However, we should still clean them up before the next command, or | ||
| # else it may interfere with it. | ||
| meister.MEISTER_REPORT_ENABLED = VERSION == DEV_VERSION |
|
Since the decorator is being added to most class methods, we could look at an automated way of adding this to the callables in a class (e.g. https://stackoverflow.com/questions/6307761/how-to-decorate-all-functions-of-a-class-without-typing-it-over-and-over-for-eac); that way we won't make so many code changes and it will be relatively easy to comment/uncomment this for code clarity. |
@bigbitbus I was also looking into this. but unfortunately we don't use classes that much and even if we do we would still have to add the decorator to each class. |
rabbitfang
left a comment
There was a problem hiding this comment.
Minor change. Otherwise, LGTM
| ASYNC_LOCK: Final = Lock() | ||
| REPORT_SIZE: Final = 20 | ||
| TIME_THRESHOLD: Final = 0.1 | ||
| REPORT_ENABLED: bool = True |
There was a problem hiding this comment.
| REPORT_ENABLED: bool = True | |
| REPORT_ENABLED: bool = False |
This will avoid measuring functions when running unit tests.
739c2a1 to
d718e48
Compare
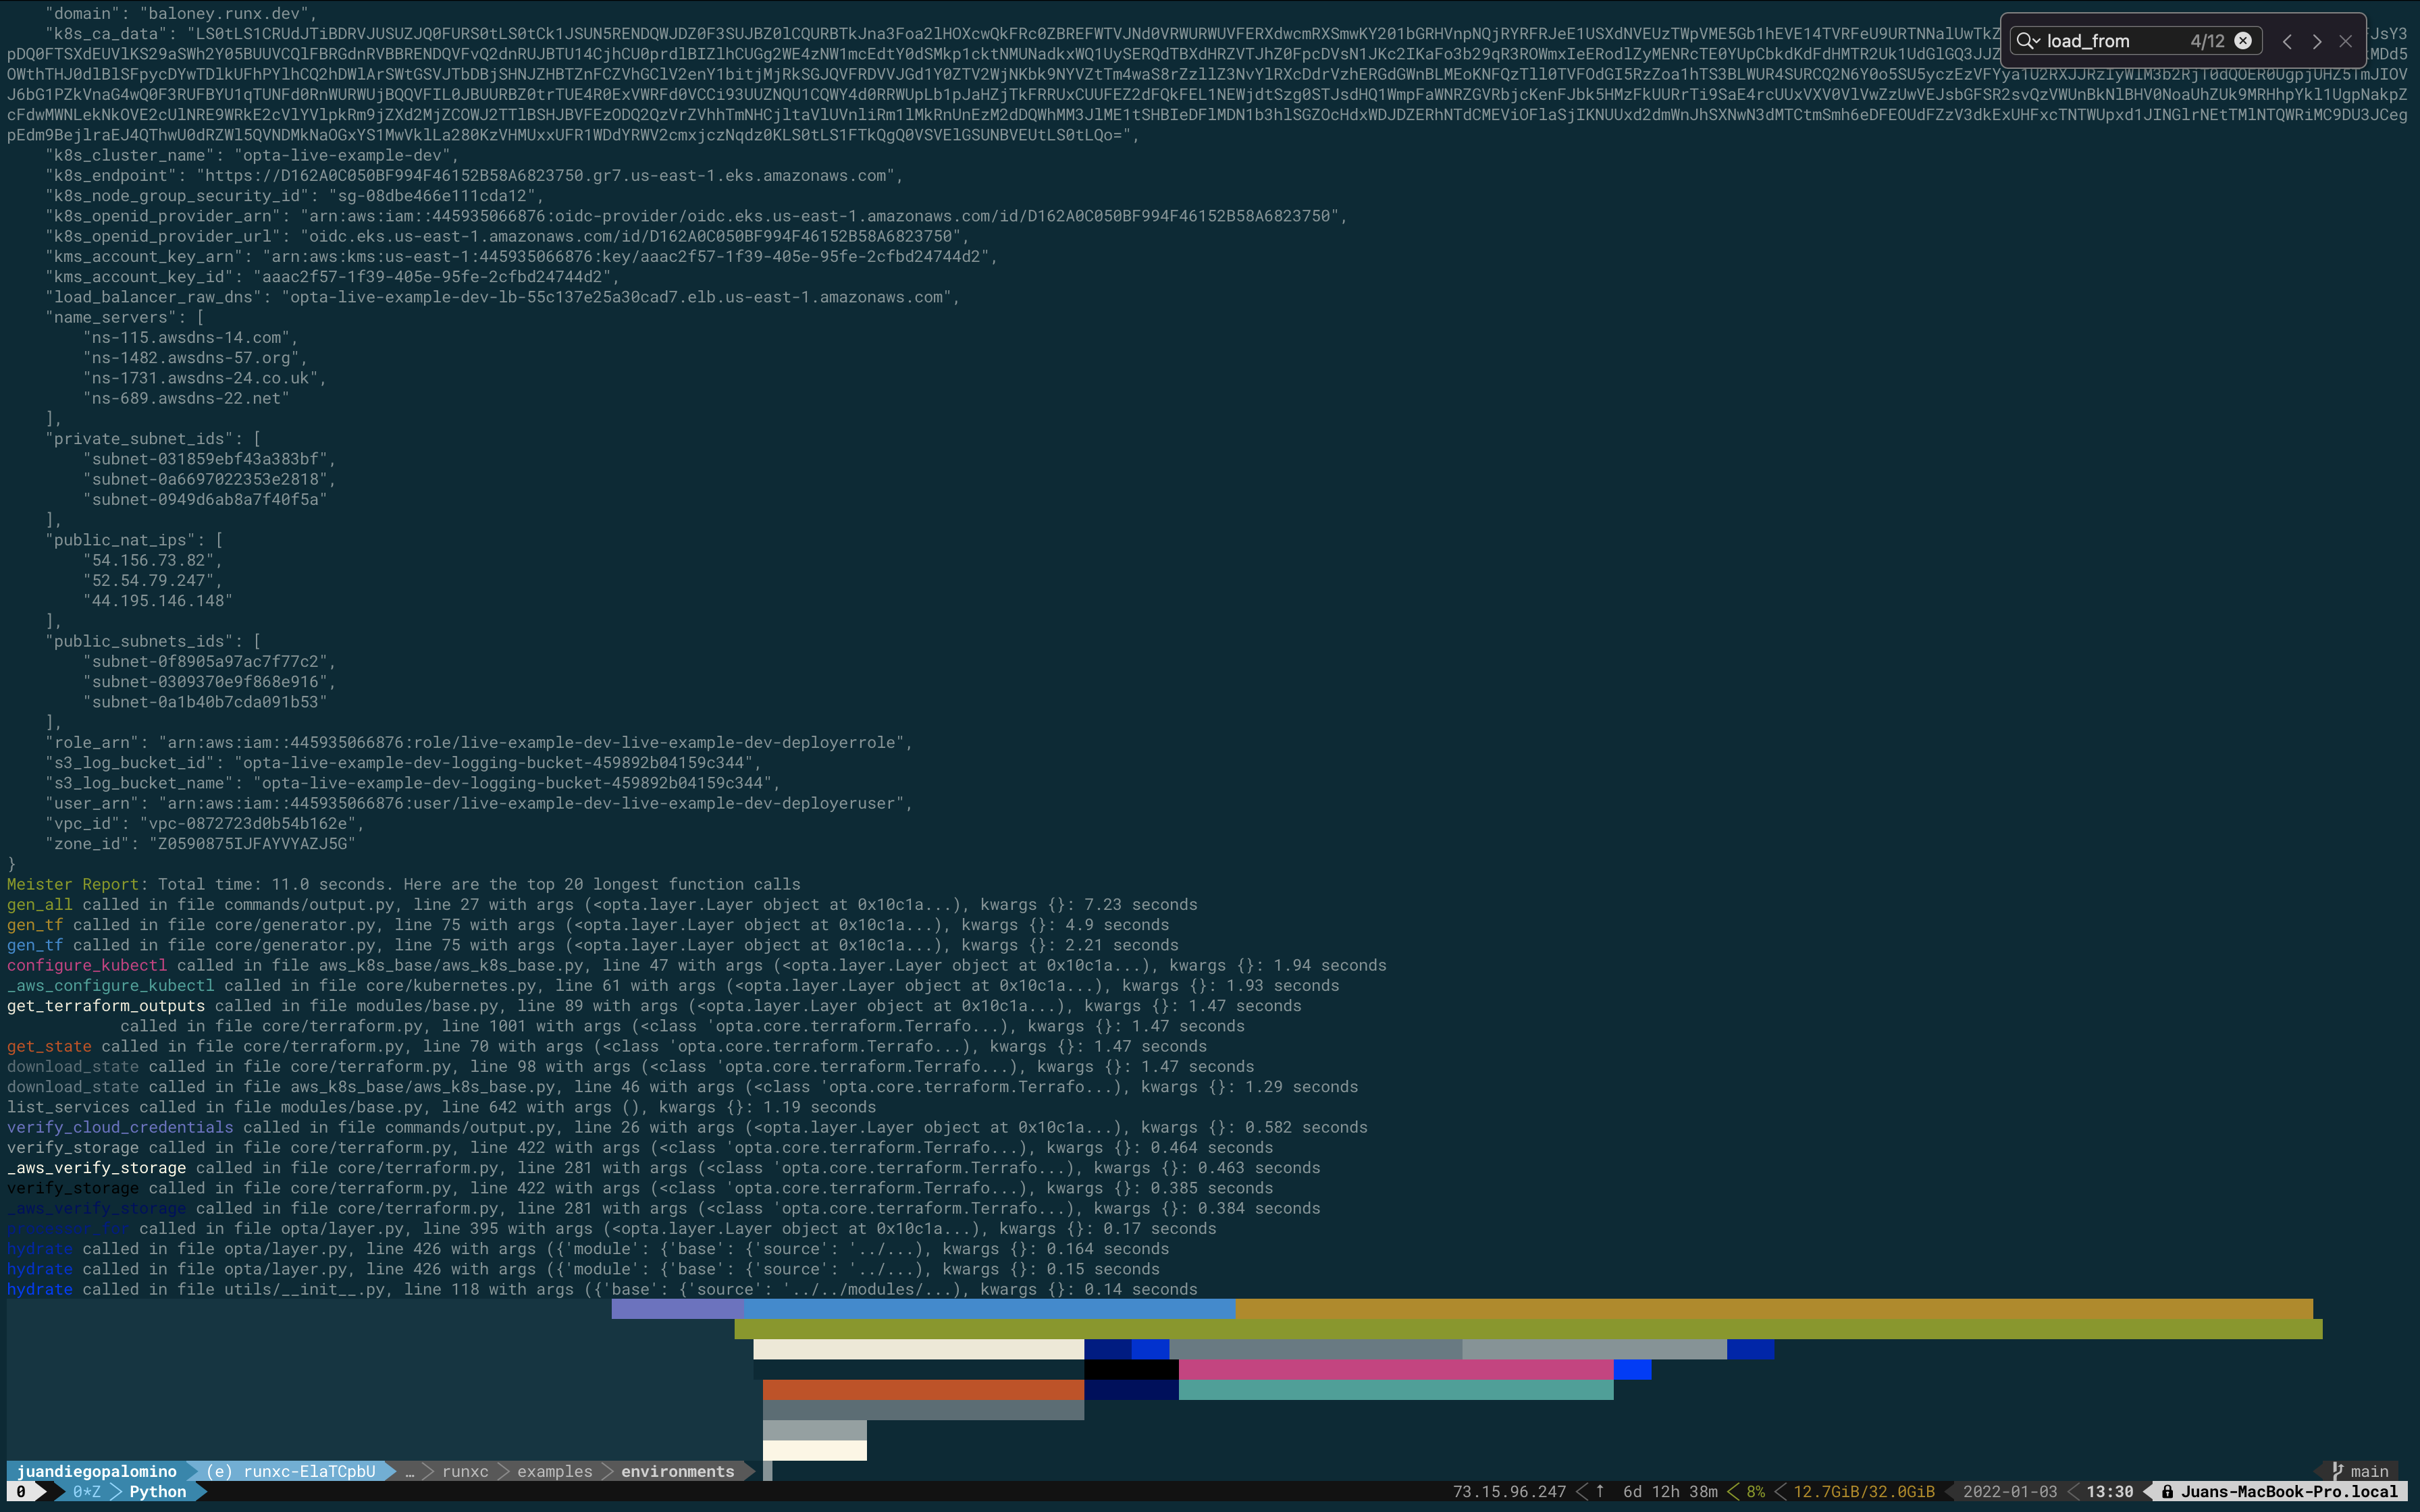
Contains the first version of the meister profiler/decorator. This is just a small package with a decorator, meister_timer, being the only thing (besides the config vars) someone should be setting. What this decorator does is simple: when a decorated function is called (works for sync and async), it prints the time it took and keeps track of the call's metadata (start time, end time, calling line, etc...) and at the end uses it to report a list of the top longest calls as well as a color-coded bar graph representing the rough times

testfixing


Update opta/meister.py

Co-authored-by: Patrick Fiedler <rabbitfang@users.noreply.github.com>
Update opta/cli.py

Co-authored-by: Patrick Fiedler <rabbitfang@users.noreply.github.com>
Update opta/meister.py

Co-authored-by: Patrick Fiedler <rabbitfang@users.noreply.github.com>
Update opta/meister.py

Co-authored-by: Patrick Fiedler <rabbitfang@users.noreply.github.com>
Update opta/meister.py

Co-authored-by: Patrick Fiedler <rabbitfang@users.noreply.github.com>
Update opta/meister.py

Co-authored-by: Patrick Fiedler <rabbitfang@users.noreply.github.com>
Update opta/meister.py

Co-authored-by: Patrick Fiedler <rabbitfang@users.noreply.github.com>
Update opta/meister.py

Co-authored-by: Patrick Fiedler <rabbitfang@users.noreply.github.com>
bug fixing


addressing cr


typo


bug fixing


bugfixing


wip
9b82758 to
9f99a69
Compare
| # after the command. | ||
| # However, we should still clean them up before the next command, or | ||
| # else it may interfere with it. | ||
| meister.REPORT_ENABLED = VERSION in [DEV_VERSION, ""] |
There was a problem hiding this comment.
Let's make this based on an env flag instead. I don't want outside contributors to run into this.
Description
Contains the first version of the meister profiler/decorator. This is just a small package with a decorator, meister_timer, being the only thing (besides the config vars) someone should be setting. What this decorator does is simple: when a decorated function is called (works for sync and async), it prints the time it took and keeps track of the call's metadata (start time, end time, calling line, etc...) and at the end uses it to report a list of the top longest calls as well as a color-coded bar graph representing the rough times
Safety checklist
How has this change been tested, beside unit tests?
Ran it locally a bunch