This is my final, inspired by Hans Rosling (https://www.ted.com/talks/hans_rosling_the_best_stats_you_ve_ever_seen)
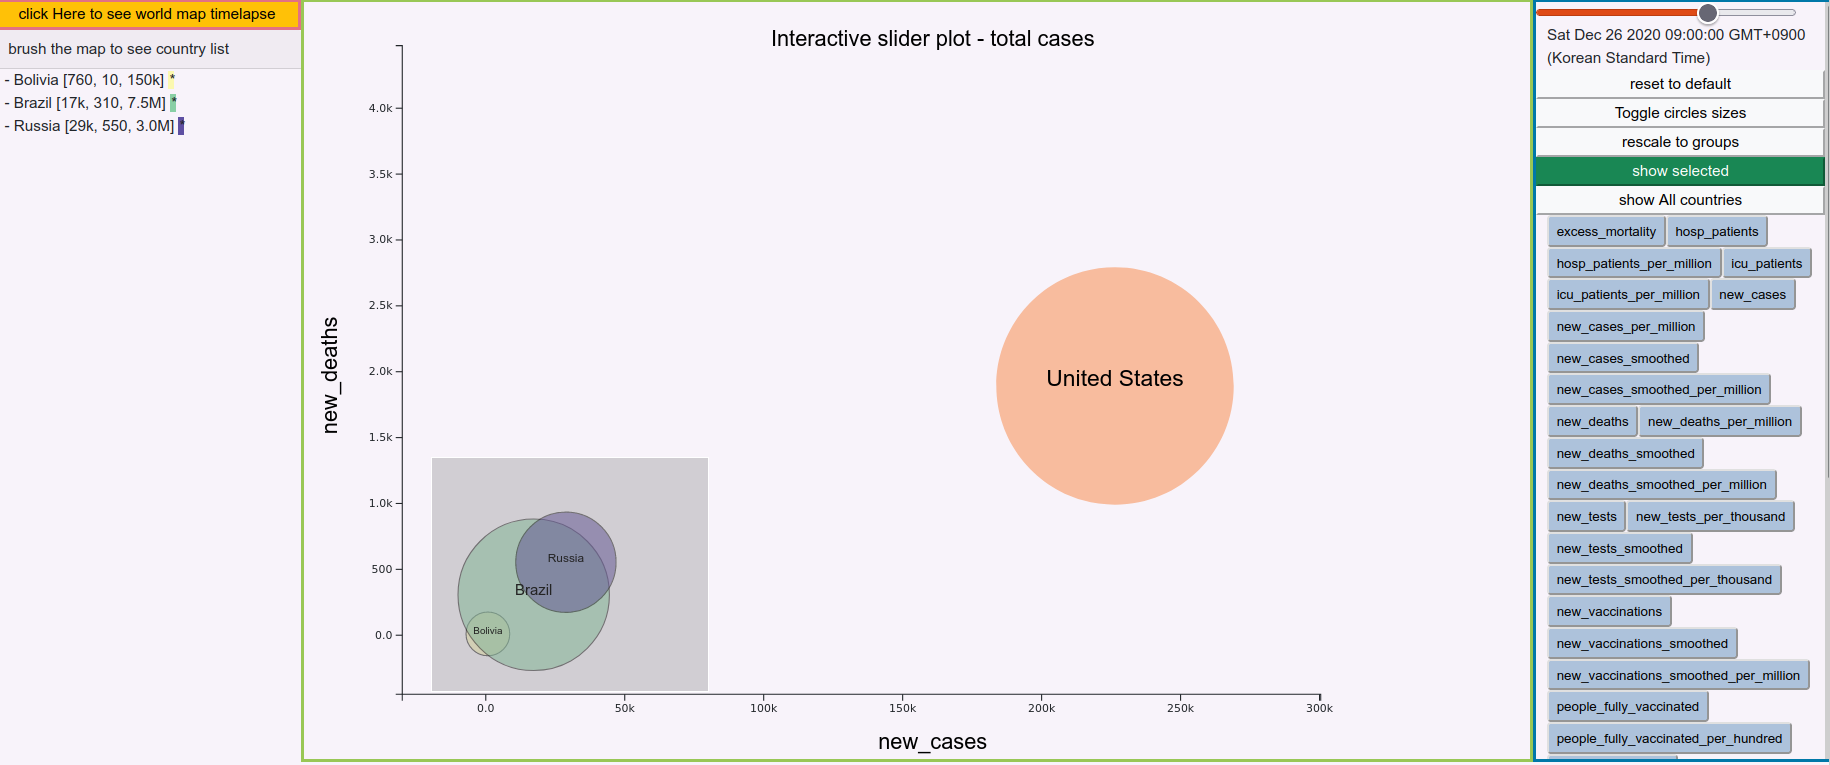
- 2 main functions: Interactive Map browsing and Cirle plots.
- Innitial loading will take some seconds.
- You can use IntelliJ ultimate and run main.html (community version will be updated latter)
- Dependency: python in your PATH.
- Type in local git folder (covid_infoVis):
python -m http.server - Go to link that the terminal output. Choose main.html.