Home
This is the introduction of the features of the visual analytics tool, jpf-visual. For information about building and running, please visit the home page of this repository. For information about design, please visit the design page.

The above image shows a screenshot of jpf-visual, which is a new tab view named Error Trace developed upon jpf-shell. Once you click the 
The navigation panel is on the left, which allows the user to expand/collapse all transitions in the main panel, or to highlight the certain part of the transitions in the main panel.
-
Collapse All and Expand All Buttons: The Collapse All button will collapse all the transitions in the main panel, while the Expand All button will expand all the transitions in the main panel. If all transitions are expanded, the Expand All button is disabled. Similarly, if all the transitions are collapsed, the Collapse All button is disables. Otherwise, both buttons will be enabled.
-
wait/notify Checkbox: If the user check the wait/notify box, the part of the transitions related to
wait(),notify()andnotifyAll()will be highlighted. Uncheck the box will undo the highlighting. -
thread start/join Checkbox: If the user check the start/join box, the part of the transitions related to starting new threads and joining a thread will be highlighted. Uncheck the box will undo the highlighting.
-
(un)lock: $ClassName Checkbox: If the user check the (un)lock: $ClassName box, the part of the transitions related to lock usage will be highlighted. Uncheck the box will undo the highlighting.
-
field access/method calls Drop-down List: The user could highlight the transition related to certain field access by choosing Field Access from the drop-down list. A dialogue which is the class field explorer is popped up, and the user can choose the field to be highlighted in the main panel. An example of the Class field explorer is shown below. There is a method explorer for the method calls as well.

The main panel shows the transition information of the error trace. It starts with a fully collapsed summary with no highlights. By clicking at the "+" symbol, the collapsed view can be expanded; the "-" symbol collapses it again.
The collapsed view shows only the first and last source code line in a transition, with an ellipsis ("...") in between if there are more than two lines. Instructions without sources are always hidden in the collapsed state. In particular, entire transition ranges may be hidden if they do not contain source code.
The user can highlight information by using the navigation panel on the left. With each selection in the navigation panel, the main panel is updated automatically. Highlighting a particular feature will highlight the corresponding code of that transition in the expanded view. It will reveal the corresponding code in the collapsed view, and add more ellipses if there are other source code lines in between lines that are shown.
Expanding a transition shows the same output as the JPF console, in particular, it includes choice generators and information about instructions without sources. However, if a transition range is entirely hidden, it is not shown at all and thus cannot be expanded either.
The panel on the right can show two views: an outline of the main tabular panel and thread state view. The outline has a finder (blue rectangle) which tells the viewport (the part you can see in the scroll panel) of the main panel. The outline can simplify the navigation in large traces and also supply a condensed representation of key thread features. The thread state view is explained below. The user can switch the two views by clicking the button on the top.
*Thread State
This view shows the changes of the states of the threads in the error trace. If a thread is active in that transition, there is a bar, otherwise it is a relatively thin vertical line. There are three colours in the view: green, red and amber. A green bar shows that the corresponding thread is runnable. A red bar shows the corresponding thread is waiting/timed_waiting. An amber bar shows that the thread is LOCKED. In addition, when the thread state is NEW/TERMINATED, the bar is blank.
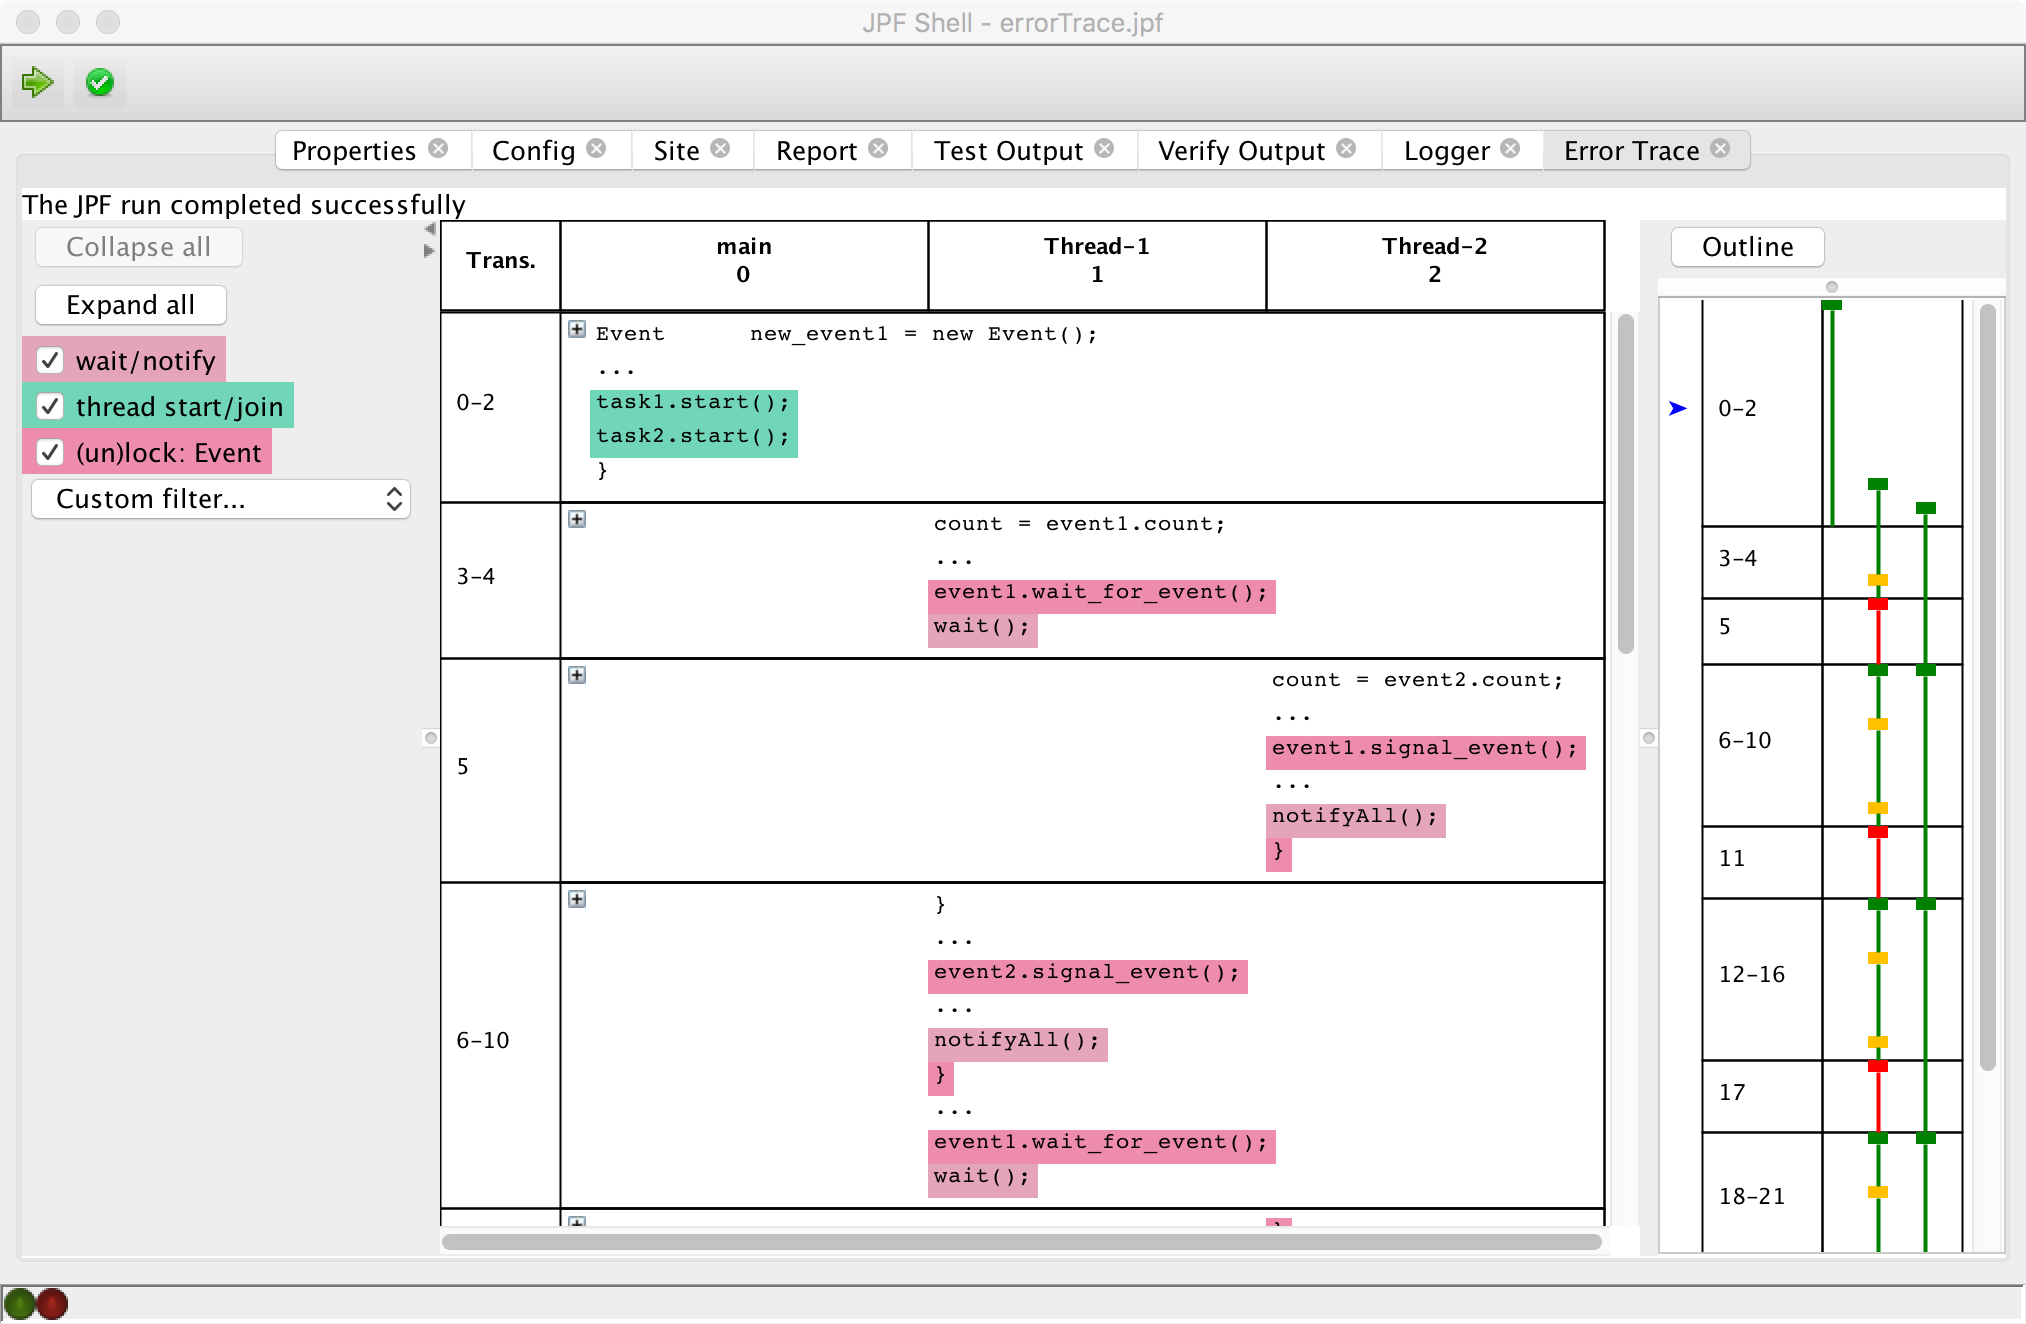
The user can click the transition range in the thread state view, a blue arrow will appear on the left to indicate the user's selection. Meanwhile, the main panel will scroll to top the corresponding transition range the user selects.
##Future Work
-
Copy multiple lines in the main panel. See also Issue #14.
-
The outline view can be implemented in the way that the width fits with the right panel and we can scroll the outline view. See Issue #33.
-
Add more "zoom levels" for transitions, such as low-level view with bytecode instructions. Noted that in the current main panel, instructions without sources are always hidden, multiple zoom levels would allow a more consistent representation of transition ranges without sources.