This Calculating Free-to-Paid Conversion Rate with SQL project aims to put your SQL skills into practice. You’ll work with an excerpt of our own data—stripped of personally identifiable information—to estimate the fraction of students who purchase a subscription after starting a lecture, i.e., the free-to-paid conversion rate among students who’ve engaged with video content on the 365 platform. You will also be tasked with calculating several other key metrics and analyzing the results.
The data you’ll be working with includes three tables storing information about students’ registration dates, engagement dates, and subscription purchase dates.
For this Calculating Free-to-Paid Conversion Rate with SQL, you’ll work with MySQL Workbench 8.0.
This practice project allows you to apply your SQL knowledge to a real-world dataset. Once you complete all tasks, you will have found the answer to the following questions:
- What is the free-to-paid conversion rate of students who have watched a lecture on the 365 platform?
- What is the average duration between the registration date and when a student has watched a lecture for the first time (date of first-time engagement)?
- What is the average duration between the date of first-time engagement and when a student purchases a subscription for the first time (date of first-time purchase)?
- How can we interpret these results, and what are their implications?
- Import the db_course_conversions database—stored in the db_course_conversions.sql file—into your schemas and study its content.
First, remember to import the db_course_conversions database and refresh the Schemas pane to see it appear. Apply the USE keyword to use the named database as the default (current) one.
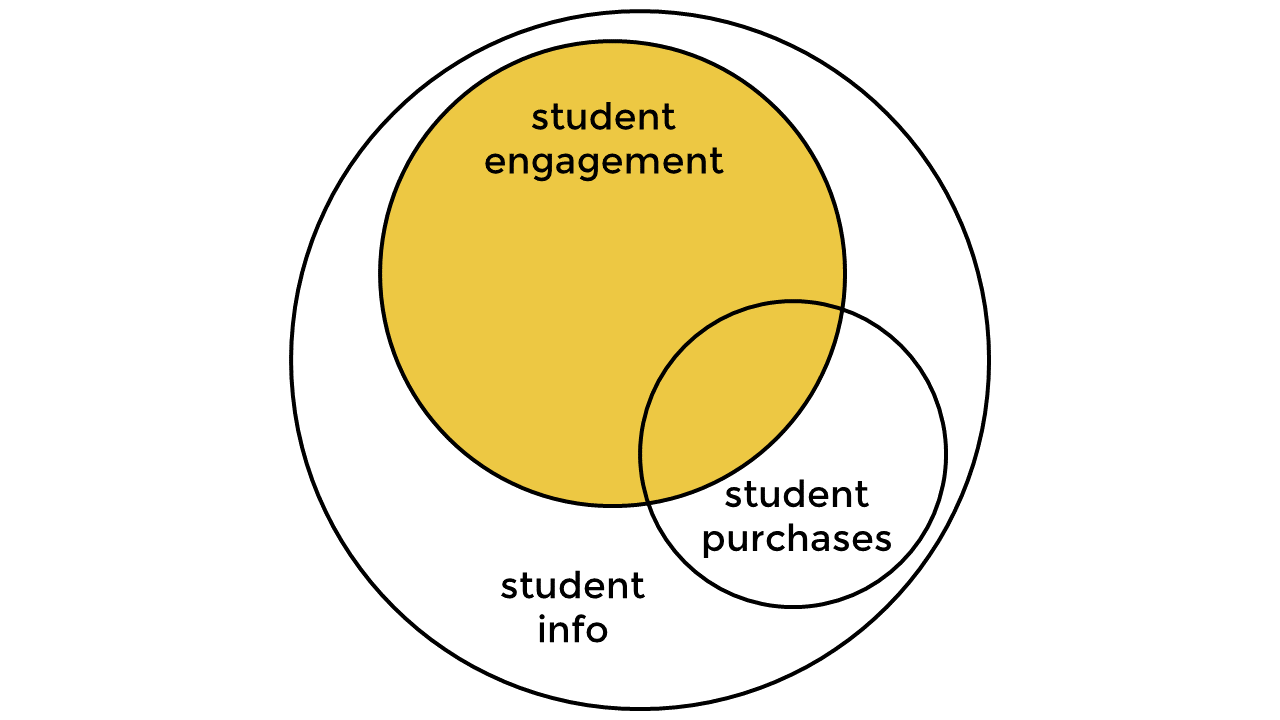
Next, join the three tables to retrieve the records shown in the Venn diagram.
Then, by appropriately joining and aggregating the tables, create a new result dataset comprising the following columns:
- student_id – (int) the unique identification of a student
- date_registered – (date) the date on which the student registered on the 365 platform
- first_date_watched – (date) the date of the first engagement
- first_date_purchased – (date) the date of first-time purchase (NULL if they have no purchases)
- date_diff_reg_watch – (int) the difference in days between the registration date and the date of first-time engagement
- date_diff_watch_purch – (int) the difference in days between the date of first-time engagement and the date of first-time purchase (NULL if they have no purchases)
- Let’s first join student_engagement with the student_info table. The Venn diagram hints that all students in the engagement table are also present in the info table. Therefore, upon joining these two tables, we’ll retrieve all students from the engagement table with their registration and engagement dates, which will be essential in the next step. We should state which field we are joining these tables on, the student_id field.
- Next, we need to join this resulting set with the student_purchases table to exclude all students who haven’t watched a lecture. This can be achieved with the LEFT JOIN clause, again joining the table on the student_id field.
- We should select a student’s registration date in the student_info table (aliased i).
- Now select the fields asked for in the task. The first is the student_id column, which we can extract from the student_engagement table (aliased e). We chose the engagement table because it stores all the records we want to obtain. (Refer to the shaded region in the Venn diagram.)
USE db_course_conversions;SELECT
e.student_id,
i.date_registered,
FROM student_engagement e
JOIN student_info i ON e.student_id = i.student_id
LEFT JOIN student_purchases p ON e.student_id = p.student_idThen, we must retrieve the first-time engagement and purchase dates from the engagement and purchase tables, respectively. We can achieve this by employing the MIN aggregate function. When applied to numbers, this function returns the smallest number in a set. It analogously retrieves the earliest date in a set when used on dates.
MIN(e.date_watched) AS first_date_watched,
MIN(p.date_purchased) AS first_date_purchased
Finally, as the task hint suggests, we can use the DATEDIFF function to find the day difference between the two dates. Note that the date that comes later should be placed as a first argument and the one that comes earlier as a second argument. Note that the DATEDIFF function will also return NULL if either date is NULL.
DATEDIFF(MIN(e.date_watched), i.date_registered) AS days_diff_reg_watch,
DATEDIFF(MIN(p.date_purchased), MIN(e.date_watched)) AS days_diff_watch_purch DATEDIFF(MIN(e.date_watched), i.date_registered) AS days_diff_reg_watch,
DATEDIFF(MIN(p.date_purchased), MIN(e.date_watched)) AS days_diff_watch_purch
In the previous step, we used the MIN aggregate function to find the earliest engagement and purchase dates. Note, however, that to find the earliest days per student, we need to group by the student_id field from the engagement table (aliased e).
SELECT
    ...
FROM
    ...
GROUP BY e.student_id;
Finally, for this task, we should filter the data so that the earliest engagement date comes before or is on the same day as the earliest purchase date. We can achieve this using the following condition:
first_date_watched <= first_date_purchased >>>>>>>
We also need to include all records whose first_date_purchased column equals NULL—indicative that the student hasn’t made a purchase.
first_date_purchased IS NULL
We need to combine these two conditions in a HAVING clause. Here, HAVING is necessary as opposed to the WHERE clause due to the aggregation in the third and fourth steps.
SELECT
    ...
FROM
    ...
GROUP BY
    …
HAVING first_date_purchased IS NULL
OR first_date_watched <= first_date_purchased;Surround the subquery you previously created in parentheses and give it an alias, say a.
(SELECT
    ...
FROM
    ...
GROUP BY
    ...
HAVING ...) a;
In this task, you should use the subquery you’ve created and retrieve the following three metrics. Use the following instructions to carry out the task.
- Surround the subquery you created in the previous part (Create the Subquery) in parentheses and give it an alias, say a.
- Consider the skeleton below. Fill in the appropriate columns to retrieve the three metrics described in this task. The results are rounded to two decimal places for clarity. Don’t forget to convert the conversion_rate metric to percentages.
This metric measures the proportion of engaged students who choose to benefit from full course access on the 365 platform by purchasing a subscription after watching a lecture. It is calculated as the ratio between:
- The number of students who watched a lecture and purchased a subscription.
- The total number of students who have watched a lecture.
- Convert the result to percentages and call the field conversion_rate.
One way to calculate the first of the three metrics (conversion_rate) is to count the number of occurrences in the first_date_purchased column and divide the result by the number of occurrences in the first_date_watched column. The COUNT function will not account for the NULL values in the former column, giving the number of students who purchased a subscription after watching a lecture. We round the number to two decimal places and multiply it by 100 to retrieve the result in percentages.
SELECT
    ROUND(COUNT(first_date_purchased) / COUNT(first_date_watched),
            2) * 100 AS conversion_rateFROM
(...) a;This metric measures the average duration between the date of registration and the date of first-time engagement. This will tell us how long it takes, on average, for a student to watch a lecture after registration. The metric is calculated by finding the ratio between:
- The sum of all such durations.
- The count of these durations, or alternatively, the number of students who have watched a lecture.
- Call the field av_reg_watch.
The second metric, av_reg_watch, can be calculated by summing all records from the days_diff_reg_watch column and dividing the result by the number of records in the same column. This will give the average duration between the date of registration and the date of first-time engagement.
SELECT
    ROUND(COUNT(first_date_purchased) / COUNT(first_date_watched),
            2) * 100 AS conversion_rate,
    ROUND(SUM(days_diff_reg_watch) / COUNT(days_diff_reg_watch),
            2) AS av_reg_watch,
FROM
(...) a;This metric measures the average time it takes individuals to subscribe to the platform after viewing a lecture. It is calculated by dividing:
- The sum of all such durations.
- The count of these durations, or alternatively, the number of students who have made a purchase.
- Call the field av_watch_purch.
Finally, the third metric is analogously found by summing all records from the days_diff_watch_purch column and dividing the result by the number of records in this column. This will give the average duration between first-time engagement and first-time purchase dates.
SELECT
    ROUND(COUNT(first_date_purchased) / COUNT(first_date_watched),
            2) * 100 AS conversion_rate,
    ROUND(SUM(days_diff_reg_watch) / COUNT(days_diff_reg_watch),
            2) AS av_reg_watch,
    ROUND(SUM(days_diff_watch_purch) / COUNT(days_diff_watch_purch),
            2) AS av_watch_purch
FROM
(...) a;WITH stu_data AS
(SELECT
e.student_id,
i.date_registered,
MIN(e.date_watched) AS first_date_watched,
MIN(p.date_purchased) AS first_date_purchased,
DATEDIFF(MIN(e.date_watched), i.date_registered) AS days_diff_reg_watch,
DATEDIFF(MIN(p.date_purchased), MIN(e.date_watched)) AS days_diff_watch_purch
FROM
student_engagement e
JOIN
student_info i ON e.student_id = i.student_id
LEFT JOIN
student_purchases p ON e.student_id = p.student_id
GROUP BY e.student_id
HAVING first_date_purchased IS NULL
OR first_date_watched <= first_date_purchased)
SELECT
ROUND(COUNT(first_date_purchased)/COUNT(first_date_watched)*100,2) AS conversion_rate,
ROUND(SUM(days_diff_reg_watch) / COUNT(days_diff_reg_watch),2) AS av_reg_watch,
ROUND(SUM(days_diff_watch_purch) / COUNT(days_diff_watch_purch),2) AS av_watch_purch
FROM stu_data;-- Calculate metrics to analyze student engagement and purchasing behavior
SELECT
-- Calculate the conversion rate: percentage of students who watched content and made a purchase
ROUND(COUNT(first_date_purchased) / COUNT(first_date_watched),
2) * 100 AS conversion_rate,
-- Calculate the average number of days between a student's registration and their first content watch
ROUND(SUM(days_diff_reg_watch) / COUNT(days_diff_reg_watch),
2) AS av_reg_watch,
-- Calculate the average number of days between a student's first content watch and their first purchase
ROUND(SUM(days_diff_watch_purch) / COUNT(days_diff_watch_purch),
2) AS av_watch_purch
FROM
(-- Select columns to retrieve information on students' engagement
SELECT
e.student_id,
i.date_registered,
MIN(e.date_watched) AS first_date_watched, -- Earliest date the student watched content
MIN(p.date_purchased) AS first_date_purchased, -- Earliest date the student made a purchase
-- Calculate the difference in days between registration date and the first watch date
DATEDIFF(MIN(e.date_watched), i.date_registered) AS days_diff_reg_watch,
-- Calculate the difference in days between the first watch date and the first purchase date
DATEDIFF(MIN(p.date_purchased), MIN(e.date_watched)) AS days_diff_watch_purch
FROM
student_engagement e
JOIN student_info i ON e.student_id = i.student_id
-- Left join the student_purchases table to get purchase data (if it exists) for each student
LEFT JOIN student_purchases p ON e.student_id = p.student_id
-- Filter out records where:
-- 1. A purchase was never made OR
-- 2. Content was watched on or before the first purchase
GROUP BY e.student_id
HAVING first_date_purchased IS NULL
OR first_date_watched <= first_date_purchased) a; -- Alias the subquery as 'a' for use in the main querySQL is a tool typically used for managing data, combined with other software when more involved data analysis tasks are required. With that in mind, below, we try to make sense of the three metrics we’ve retrieved.
-
Let’s first discuss the result we obtained for the free-to-paid conversion rate metric. The fraction of students who purchase monthly, quarterly, or annual subscriptions from those who watch a lecture is about 11%—i.e., for every 100 students who come to the 365 platform, roughly 11 of them purchase a subscription. At first glance, this number seems relatively low, but let’s dig a bit deeper.
-
A significant number of students register on the platform out of curiosity. Nevertheless, we can outline why most students aren’t prompted to benefit from the program entirely. One factor contributing to this could be that we’re targeting a broader audience rather than focusing specifically on data science enthusiasts eager to begin their journey in the field.
-
Second, since our platform targets a beginner audience, students may need clarification about what to start with. Should they first invest weeks in mastering an object-oriented programming language such as Python, a query language such as SQL, or maybe a data visualization software like Tableau? What prerequisites are necessary for each of these tools? In August 2023, the team at 365 put effort into making its audience’s journey much easier by introducing an onboarding sequence that creates a customized learning path for each of its students. This way, users will know exactly where to start and how to continue.
-
Still, some users might need more time to embark on a data science journey. They might be college students whose exam periods have just started or working people who can’t dedicate the desired time.
-
Finally, we must consider that some users might not fancy the platform and would instead take the first steps toward data science elsewhere. Still, whatever the reason, reaching out to customers is essential, pinpointing any flaws and striving towards a better product.
-
The results from the second metric indicate that, on average, it takes students between three and four days to start watching a lecture after registering on the platform. Ideally, it would be great if a new student started watching a lecture on their first day. Every other element the platform offers (exams, projects, career tracks) requires more attention, while the lessons are easy to check out. It’s worth diving a bit deeper into this analysis.
-
The dataset’s average is a metric that shouldn’t be studied in a vacuum because outliers heavily affect it. It’s, therefore, essential to study the other two metrics that typically come hand-in-hand with the average: median and mode. The median tells us which number sits in the middle of a dataset—assuming it’s ordered—while the mode is the number that occurs most often in a dataset. Calculating these is not as straightforward in SQL—so you can use another tool. I’ve chosen Python. The results are as follows:
-
Mode: 0
-
Median: 0
-
Mean: 3.42
-
The number that repeats the most in the data is 0. Additionally, the number that sits in the middle of the dataset is also 0. Such metric values indicate the right-skewness of the data—i.e., we can find outliers to the right, towards higher values, of the data distribution. This implies that some students in the dataset have registered on the 365 platform but started watching a lecture much later. To convince ourselves, let’s also study visually the distribution of the numbers.
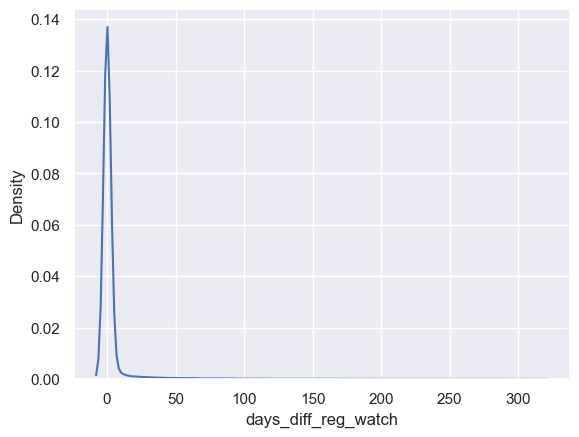
- Almost all students watch a lecture immediately after registering. Very few return to the platform to start a course several days or even a year after registration. One reason for returning could be because of a marketing campaign, a free-day campaign, etc.
-
Let’s study analogously the average duration between the first-time engagement and purchase. The results we retrieved from our SQL analysis show that, on average, it takes students roughly 24 days to purchase a subscription after getting acquainted with the product. Once again, we should take this result with a grain of salt and study the other relevant metrics: median and mode. Using, for example, Python, we can calculate the three metrics, which turn out to be as follows:
-
Mode: 0
-
Median: 1
-
Mean: 26
-
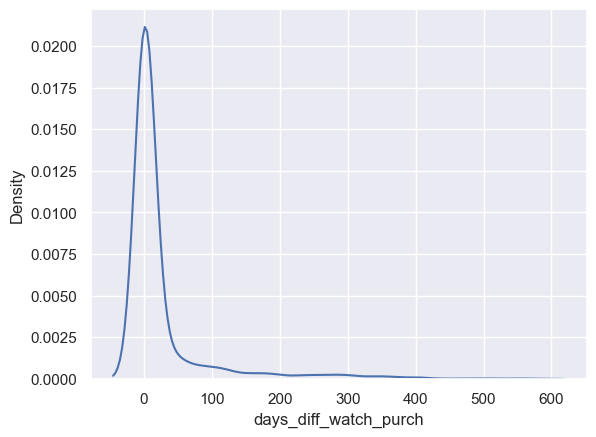
We see that the mean is significantly higher than the other two metrics. This points towards the presence of even more extreme outliers in this dataset. Let’s discuss the metrics one by one. The most occurring value is again 0. Therefore, students who purchase a subscription are prone to do it on the same day. The value in the middle of the dataset—assuming it’s ordered—is 1, which means that the people who buy on the same day are less than half of all users making a purchase. To be more specific, about 49% of the people purchase on the day they’ve watched a lecture for the first time. The mean value, however, assumes that the transition from free-plan to paying students happens for almost a month. Let’s again estimate this discrepancy visually.
-
We can again see that the data is skewed to the right, which we could’ve inferred from the fact that the mode is smaller than the median, which, in turn, is smaller than the mean. As we can see, most users purchase within a day or two after they’ve watched a lecture. Some people, however, purchase several months later. One reason could be that they liked the content on the platform but have been waiting for the product to be offered at an exclusive price.
-
Now that you’re familiar with the problem, can you think of any other analysis that could be performed? Feel free to play around with the dataset, explore other key metrics, and, most importantly, solidify your SQL knowledge.