The purpose of this analysis is to provide insight into how successful various fundraising campaigns for theater projects, specifically plays, were from 2009 - 2017, when compared to their launch date and fundraising goal. This information will then be used to help make an informed decision on the best funding strategy for the play Fever.
Prior to starting this analysis, columns needed to be added to the Kickstarter dataset by breaking down the "category and subcategory" column into "parent category" and "subcategory." By creating separate columns, the data can be further analyzed by differentiating between plays and the other subcategories that fall under the parent category of theater.
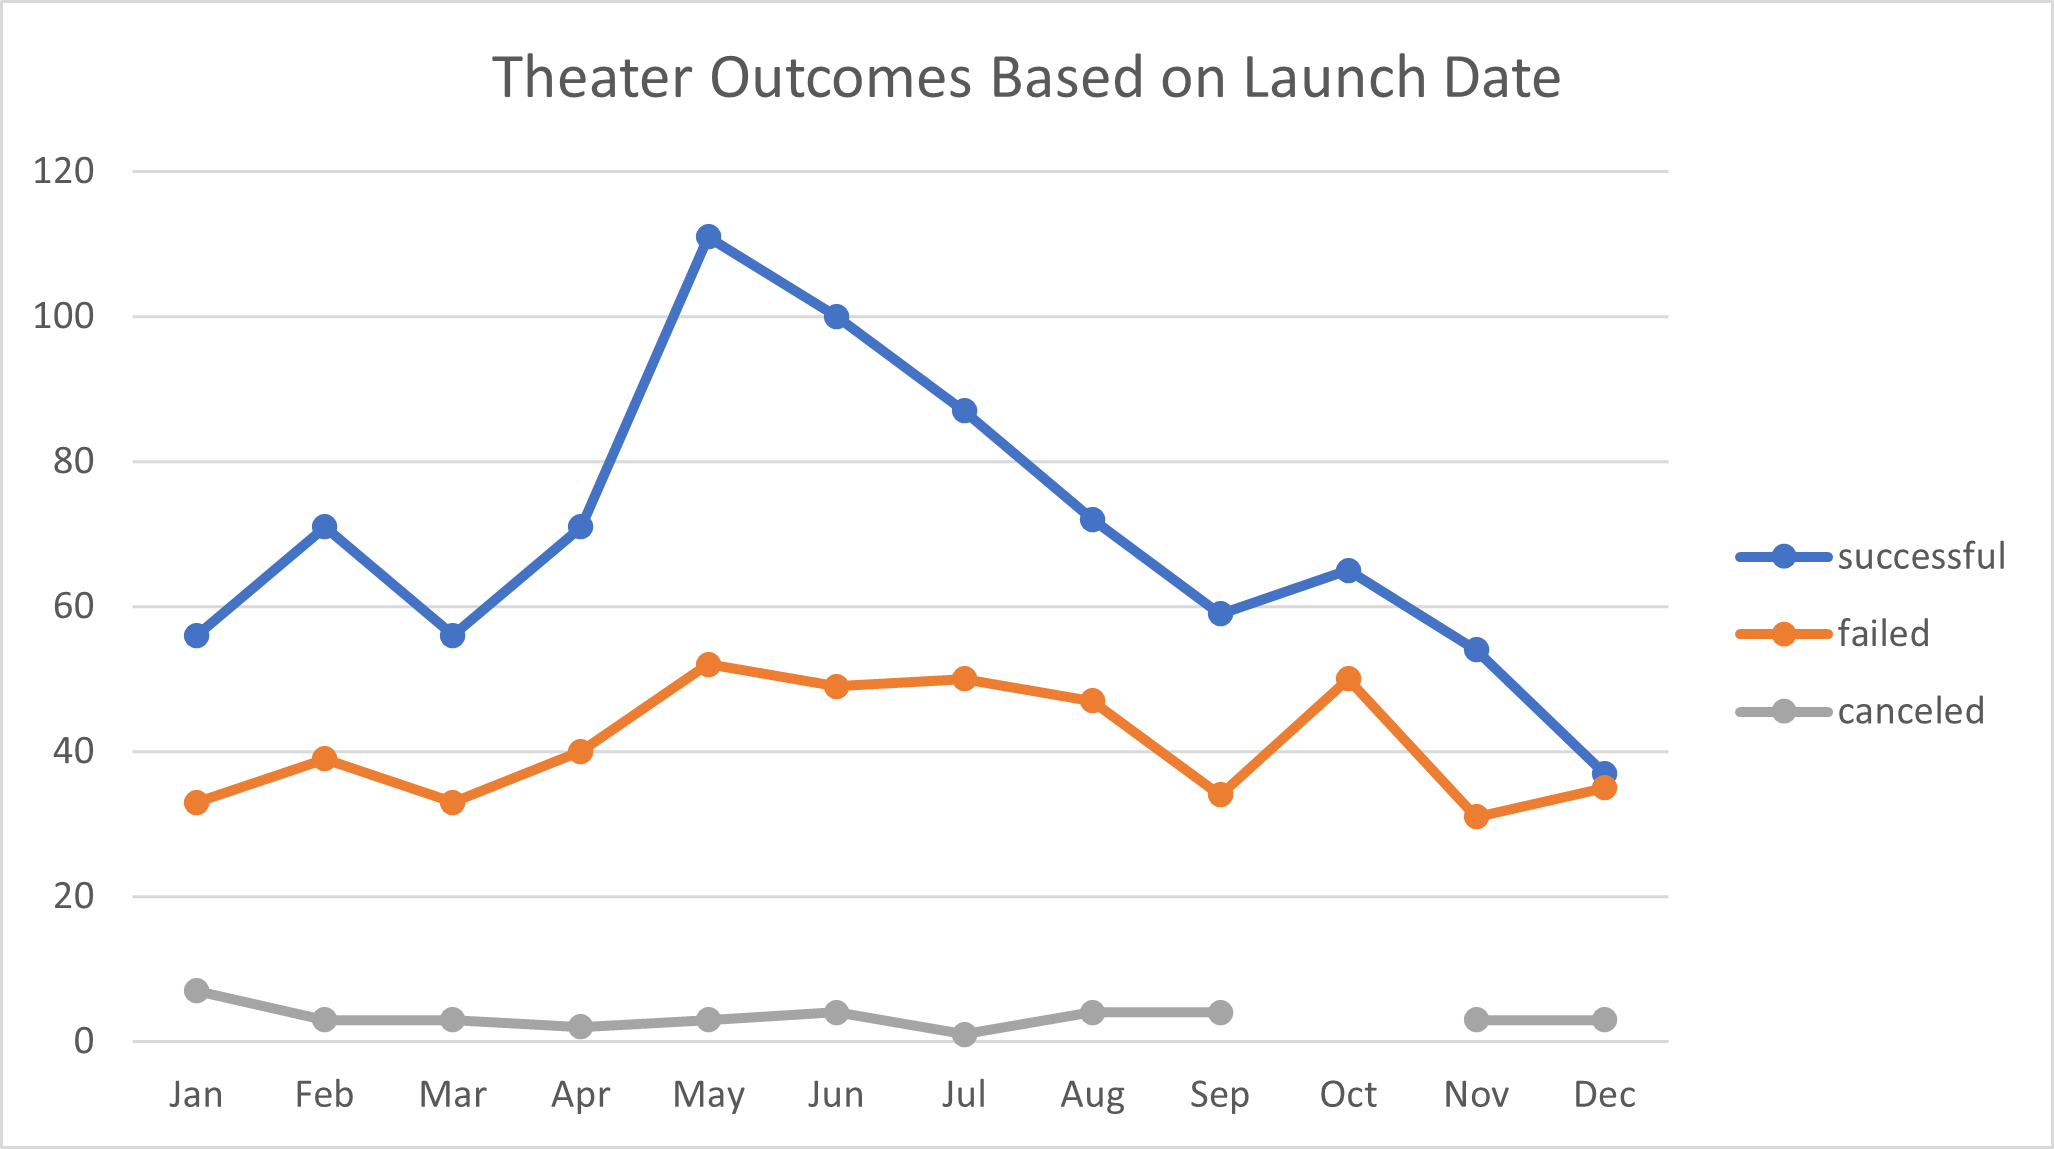
The focus of this analysis was to compare the outcome (success, failure, cancelation) of the fundraising campaign to its respective launch month. First, a "year" column needed to be added to the Kickstarter dataset. The addition of the "year" column allows for more accurate analysis as you can spot trends over time that would otherwise be missed. The "year" column was added by extracting the year from the "date created conversion" column. Next, a pivot table was created using the raw Kickstarter data. The data was then filtered to show only the theater parent category, as we were only concerned about the campaigns in this category. The data added to the pivot table is " launch month" as a "row", "outcome" as the "column", and the "value" as "count of outcome". A line graph was then created based off the data in the pivot table which visualizes the relationship between count of each theater campaign outcome and its launch month.
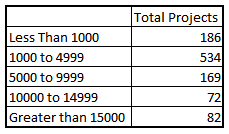
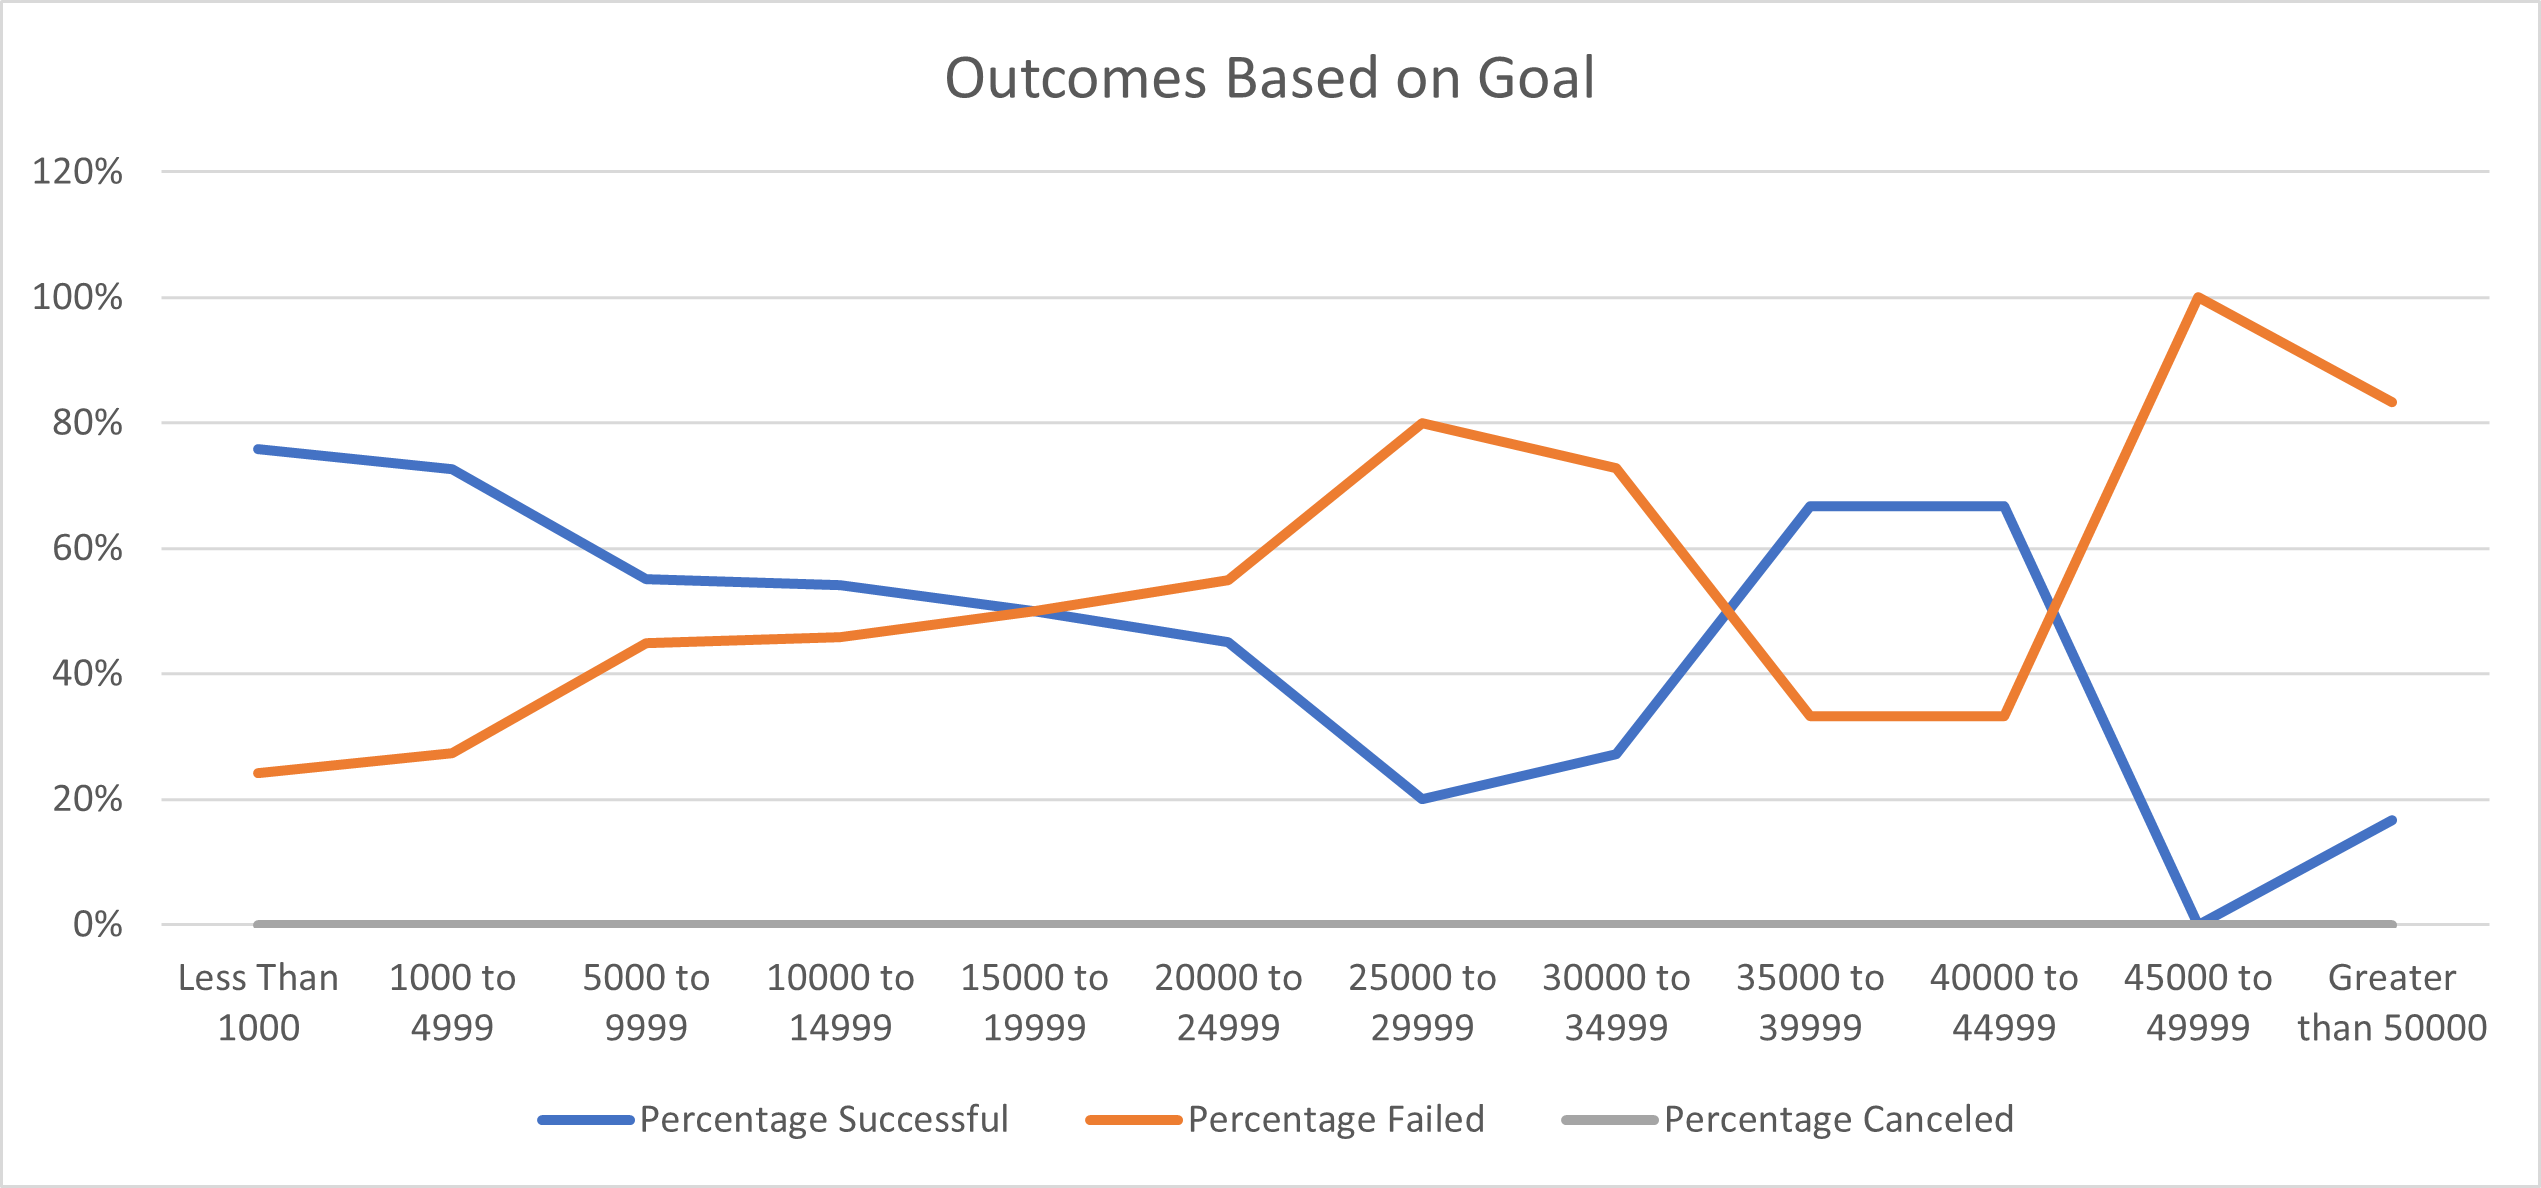
The focus of this analysis was to compare the outcome of the fundraising campaign to the respective fundraising goal. Categories were created for the fundraising goals, grouping them by less than $1,000, $1,0000 to $4,999, then by $5,000 increments until a greater than $50,000 grouping was reached. The "count ifs" statement was used to count the number of outcomes that fall into each goal grouping. The "count ifs" function allows for a count to be completed while filtering across multiple criteria. In this scenario the data was filtered by subcategory, to get to a subset of data that only includes plays, and by outcome, to group data by success, failure or cancelation. Next, the "sum" function was used, allowing for a total to be seen across each goal grouping. Then a ratio of successful, failed or cancelled campaigns compared to the total number of campaigns across each goal grouping was calculated by dividing the number in each outcome by the total. Lastly, these ratios across all the goal groupings are visually represented in a line graph.
The main challenge encountered during this project was getting the filtering criteria correct when using the "count ifs" function. The filtering for each goal grouping needed to be updated to match the range that grouping is covering and the filtering for the various outcomes needs to be updated. For example, in the less than 1,000 grouping there needs to be three separate formulas, filtering column F (outcomes) by successful, failed and cancelled. Initially the update to the filtering in the "count ifs" formula was missed. This resulted in the count across all outcomes being the same. This result seemed highly unlikely and prompted further review of the formula. Further analysis allowed the mistake to be uncovered and corrected.
One conclusion that can be drawn from Theater Outcomes by Launch Date is that the months with the greatest percentage of successful campaigns are April and June, with 67% and 65% success rates respectively. These are also the months with the highest number of campaigns. Therefore, an assumption can be made that there is a correlation between number of campaigns and success rates. Campaigns launched between October - December are least successful, with an average of a 42% failure rate across those three months . Cancellations rates remain relatively low throughout the year, averaging 3% from February - December. However, cancellation rates spike up to 7% in January.
One conclusion that can be drawn from Outcomes Based on Goals is that campaigns with less than a $5000 goal are more likely to succeed than the other groupings reviewed. There is an average of 74% approval rate for campaigns with less than a $5000 goal. This is 19% higher than any other goal grouping.
Limitations of this dataset include a small sample size across certain buckets we were doing an analysis of. The limited sample size makes it challenging to make statements with a level of confidence. For example, when looking at the data on Outcomes Based on Goals there is only one campaign in the $45,000 - $49,999 bucket. This campaign resulted in a failed result. Based on this there is a 100% failure rate for campaigns in this goal grouping. However, we cannot say with any certainty that another campaign with a goal between $45,000 - $49,999 would fail. We would need a larger sample size to make assumptions about future success rates.
A recommendation for a table to include in a future analysis would be to expand the grouping buckets for the table in Outcomes Based on Goals. The result would be an increase the sample size. For example, you could change the groupings to the buckets seen below and that would allow for statements to be made with stronger certainty because there are more campaigns in each bucket.