Five sql queries for google_search_console #13
There are no files selected for viewing
| Original file line number | Diff line number | Diff line change |
|---|---|---|
| @@ -0,0 +1,27 @@ | ||
| # Average Search Volume - Last 4 Weeks | ||
|
|
||
| Instructions | Details | ||
| ---|--- | ||
| Description | Displays the average amount of search traffic coming to your site each day of the week over the last four weeks. | ||
| Requirements | Collect the Panoply Google Search Console data source with the default set of metrics and dimensions. Dimensions used: `date`. Metrics used: `clicks` and `impressions`. | ||
| Usage | Create a bar chart showing which days bring the most traffic. Highlight the worst-performing days and set aside for more in-depth analysis. | ||
| Modifications | <ul> <li><b>Change date range:</b> In the WHERE clause, change `'4 weeks'` to `'N weeks'` to get the average search volume for the last N weeks (for some whole number N)</li><li><b>Any daily total/average:</b> Aggregate different columns to get different daily totals/averages e.g. `SUM(clicks)` gives you the total number of clicks your site has received on each day over the last 4 weeks.</li><li><b>Alternate day ordering: </b>If you want the week to begin on Sunday, change the first column in the `SELECT` statement to `TO_CHAR(date, 'D')`. The current form is `'ID'` which stands for 'International Date'. This is the ISO 8601 international date time format which has weeks begin on Monday.</li></ul> | ||
|
|
||
| ```sql | ||
| SELECT day_of_week, | ||
| avg_search_vol | ||
| FROM (SELECT TO_CHAR(DATE,'ID') AS day_number, | ||
| TO_CHAR(DATE,'Day') AS day_of_week, | ||
| AVG(clicks*1.00 / impressions) AS avg_search_vol | ||
| FROM google_search_console_blog | ||
| WHERE DATE>= CURRENT_DATE-INTERVAL '4 weeks' | ||
| GROUP BY day_number, | ||
| day_of_week) | ||
| ORDER BY day_number | ||
| ``` | ||
|
|
||
| ## Query Results Dictionary | ||
| Column | Description | ||
| ---|--- | ||
| `day_of_week`| The day of the week. | ||
| `avg_search_vol`| The average amount of traffic brought to your website through search on each day of the week. |
| Original file line number | Diff line number | Diff line change |
|---|---|---|
| @@ -0,0 +1,33 @@ | ||
| # Top 100 Pages in Last 7 Days | ||
|
|
||
| Instructions | Details | ||
| ---|--- | ||
| Description | Display the top 100 most clicked pages on your site in the last seven days. Plus, other useful statistics. | ||
| Requirements | Collect the Panoply Google Search Console data source with the default set of metrics and dimensions. Dimensions used: `date` and `page`. Metrics used: `clicks`, `ctr`, `position`, and `impressions`. | ||
| Usage | Create a table to see the most fundamental statistics for the top-performing pages on your site. Track these statistics over time using a bar or line chart. | ||
| Modifications | <ul><li> <b>Custom date range:</b> In the `WHERE` clause, change `'7 days`' to `'N days'` to display the top 100 pages in the last N days, for some whole number N.</li> <li> <b>Custom number of pages:</b> In the `ORDER BY` clause, change `LIMIT 100` to `LIMIT N` to show the top N pages, for some whole number N.</li> <li><b>Simplified view:</b> To just see the pages and the total number of clicks, only include the first two colums in the `SELECT` statement.</li> </ul> | ||
|
|
||
|
|
||
| ```sql | ||
| SELECT | ||
| page, | ||
| SUM(clicks) AS total_clicks, | ||
| SUM(impressions) AS total_impressions, | ||
| SUM(ctr * impressions) / SUM(impressions) AS weighted_average_ctr, | ||
| SUM(position * impressions) / SUM(impressions) AS weighted_average_rank, | ||
| SUM(impressions - clicks) AS missed_opportunity | ||
| FROM google_search_console_blog | ||
| WHERE date > current_date - interval '7 days' | ||
| GROUP BY page | ||
| ORDER BY total_clicks DESC LIMIT 100; | ||
| ``` | ||
|
|
||
| ## Query Results Dictionary | ||
| Column | Description | ||
| ---|--- | ||
| `page`| The page on your site appearing in search results. | ||
| `total_clicks`| The number times this page was clicked in the last seven days. | ||
| `total_impressions` | The number of times this page was displayed in Google search results over the last seven days. | ||
| `weighted_average_ctr` | The average click-through rate for this page in the last seven days. | ||
| `weighted_average_rank`| The average position this page appeared in the last seven days in Google's search results. | ||
| `missed_opportunity`| The number of impressions minus the number of clicks i.e., the number of times the page was seen and not clicked. Pages with a high number of missed opportunities would be excellent targets for increasing your organic search traffic (they are already ranking well, but not many people are clicking through. Why might this be?). |
| Original file line number | Diff line number | Diff line change |
|---|---|---|
| @@ -0,0 +1,43 @@ | ||
| # Top 20 Most Improved Queries Week on Week | ||
|
|
||
| Instructions | Details | ||
| ---|--- | ||
| Description | Display the top 20 queries with the most significant increase in average position over the last week. | ||
| Requirements | Collect the Panoply Google Search Console data source with the default set of metrics and dimensions. Dimensions used: `date`. Metrics used: `query`, `position`, and `impressions`. | ||
| Usage | Create a table or bar chart to see which queries have improved the most week on week. | ||
| Modifications | <ul><li><b>Custom date range:</b> In all `WHERE` clauses, change `'7 days'` to `'14 days'` and `'14 days'` to `'28 days'` to see the best performing queries fortnight on fortnight.</li> <li><b>Custom number of queries: </b> Change the `ORDER BY` clause from `LIMIT 20` to `LIMIT N` to see the top N performing queries week on week, for some whole number N.</li></ul> | ||
|
|
||
| ```sql | ||
| SELECT | ||
| this_week.query AS query, | ||
| this_week.avg_pos AS this_week_avg_pos, | ||
| last_week.avg_pos AS last_week_avg_pos, | ||
| last_week.avg_pos - this_week.avg_pos AS difference | ||
| FROM | ||
| (SELECT | ||
| query, | ||
| SUM(position * impressions) / SUM(impressions) AS avg_pos | ||
| FROM google_search_console_blog | ||
| WHERE date < current_date | ||
| AND date >= current_date - interval '7 days' | ||
| GROUP BY query) AS this_week | ||
| INNER JOIN | ||
| (SELECT | ||
| query, | ||
| SUM(position * impressions) / SUM(impressions) AS avg_pos | ||
| FROM google_search_console_blog | ||
|
|
||
| WHERE date < current_date - interval '7 days' | ||
| AND date >= current_date - interval '14 days' | ||
| GROUP BY query) AS last_week | ||
| ON this_week.query = last_week.query | ||
| ORDER BY difference DESC LIMIT 20; | ||
| ``` | ||
|
|
||
| ## Query Results Dictionary | ||
| Column | Description | ||
| ---|--- | ||
| `query`| The search term typed into Google that your page(s) have ranked for. | ||
| `this_week_avg_pos`| The average position for that query this week. | ||
| `last_week_avg_pos`| The average position for that query last week. | ||
| `difference`| The change in average position week on week. A positive number means an increase in position and that the query ranks closer to #1. For example, if a page ranked #40 last week and #5 this week, the difference is 40 - 5 = 35. Thus the page has increased its position by 35. |
| Original file line number | Diff line number | Diff line change |
|---|---|---|
| @@ -0,0 +1,42 @@ | ||
| # Top 20 Worsened Queries Week on Week | ||
|
|
||
| Instructions | Details | ||
| ---|--- | ||
| Description | Display the top 20 queries with the most significant decrease in average position week on week. | ||
| Requirements | Collect the Panoply Google Search Console data source with the default set of metrics and dimensions. Dimensions used: `date`. Metrics used: `query`, `position`, and `impressions`. | ||
| Usage | Create a table or bar chart to see which queries have worsened the most week on week. | ||
| Modifications | <ul><li><b>Custom date range:</b> In all `WHERE` clauses, change `'7 days'` to `'14 days'` and `'14 days'` to `'28 days'` to see the worst performing queries fortnight on fortnight.</li> <li><b>Custom number of queries: </b> Change the `ORDER BY` clause from `LIMIT 20` to `LIMIT N` to see the top N worst performing queries week on week, for some whole number N.</li></ul> | ||
|
|
||
| ```sql | ||
| SELECT | ||
| this_week.query AS query, | ||
| this_week.avg_pos AS this_week_avg_pos, | ||
| last_week.avg_pos AS last_week_avg_pos, | ||
| last_week.avg_pos - this_week.avg_pos AS difference | ||
| FROM | ||
| (SELECT | ||
| query, | ||
| SUM(position * impressions) / SUM(impressions) AS avg_pos | ||
| FROM google_search_console_blog | ||
| WHERE date < current_date | ||
| AND date >= current_date - interval '7 days' | ||
| GROUP BY query) AS this_week | ||
| INNER JOIN | ||
| (SELECT | ||
| query, | ||
| SUM(position * impressions) / SUM(impressions) AS avg_pos | ||
| FROM google_search_console_blog | ||
| WHERE date < current_date - interval '7 days' | ||
| AND date >= current_date - interval '14 days' | ||
| GROUP BY query) AS last_week | ||
| ON this_week.query = last_week.query | ||
| ORDER BY difference ASC LIMIT 20; | ||
| ``` | ||
|
|
||
| ## Query Results Dictionary | ||
| Column | Description | ||
| ---|--- | ||
| `query`| The search term typed into Google that your page(s) have ranked for. | ||
| `this_week_avg_pos`| The average position for that query this week. | ||
| `last_week_avg_pos`| The average position for that query last week. | ||
| `difference`| The change in average position week on week. A negative number means a decrease in position and that the query ranks further away from #1. For example, if a page ranked #5 last week and #40 this week, the difference is 5 - 40 = -35. Thus, the page has decreased its position by 35. | ||
| Original file line number | Diff line number | Diff line change |
|---|---|---|
| @@ -0,0 +1,42 @@ | ||
| # Top 5 Most Clicked "First Appearance" Queries Per Page In The Last 7 Days (Top 100 Pages) | ||
|
|
||
| Instructions | Details | ||
| ---|--- | ||
| Description | <ul><li>Display the top 100 pages with the most clicks generated by "first appearance" queries in the last seven days. For each page, also display the five "first appearance" queries that generated the clicks.</li><li>We define a <b>"first appearance" query</b> as a query that has position ≤ 30 this week and has never had position ≤ 30 before. It may or may not have clicks, but will at least have one impression.</li><li>"First appearance" queries have an upward trajectory. So, by optimizing your pages for these keywords, it is possible to increase your search traffic.</li><li>Note: since not every page on your site will have five "first appearance" queries each week, this query will not always return 100 pages accompanied by five queries. Nor will each page always have five queries, they may have less than that.</li></ul> | ||
| Requirements | Collect the Panoply Google Search Console data source with the default set of metrics and dimensions. Dimensions used: `date`, `page`, and `query`. Metrics used: `clicks` and `position`. | ||
| Usage | Create a table to see which new keywords pages are ranking for each week. Create a bar or line chart to show how many more keywords each page ranks for over time. | ||
| Modifications | <ul><li><b>Custom number of queries: </b>In the final `FROM` statement, change `WHERE rank <= 5` to `WHERE rank <= N` to get the top N most clicked "first appearance" queries per page, for some whole number N.</li> <li><b>Custom date range: </b>Change all instances of `'7 days'` to `'N days'` to get the top 5 most clicked "first appearance" queries in the last N days, for some whole number N.</li></ul> | ||
|
|
||
| ```sql | ||
| WITH first_appearance_queries AS( | ||
| SELECT | ||
| page, | ||
| query, | ||
| SUM(clicks) AS total_clicks, | ||
| ROW_NUMBER() OVER(PARTITION BY page ORDER BY total_clicks DESC) AS rank | ||
| FROM google_search_console_blog | ||
| WHERE date >= current_date - interval '7 days' | ||
| AND position <= 30 | ||
| AND query IN (SELECT query | ||
|
Contributor
There was a problem hiding this comment. From my understanding this does not check
Author
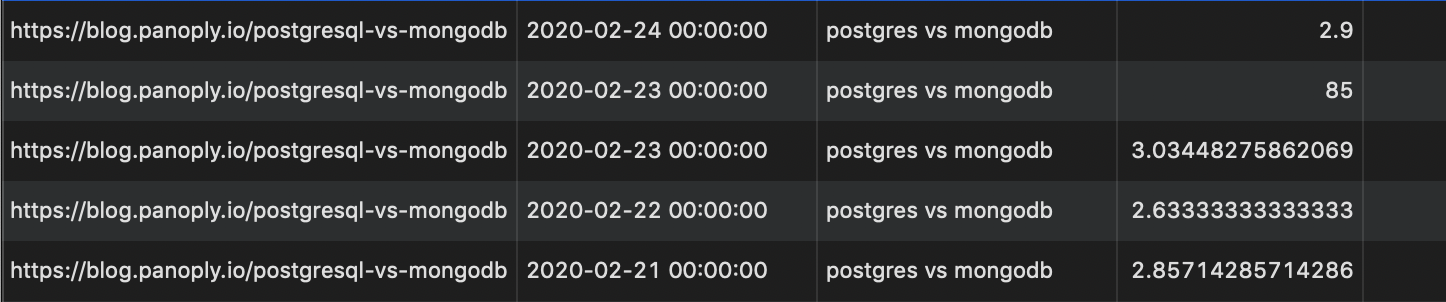
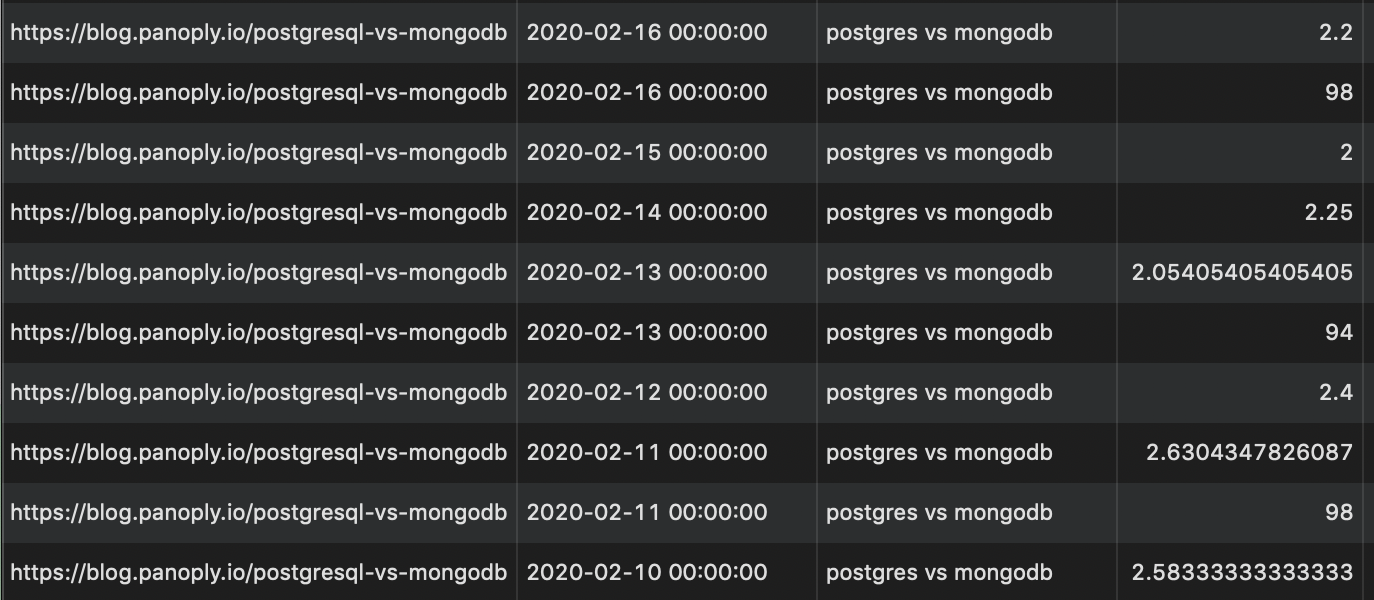
There was a problem hiding this comment. Hmm ok, I've done some research, and you're right. My thinking was: in general, the trend for a particular keyword should be towards 1 so it's unlikely it will have flip-flopped between above and below 30 for an extended period. But I've checked the data, and it looks weird. Here's what I've found: Why can queries be both below and above 30?
I'm not too well versed in SQL but these funny looking results make me think that perhaps this query is asking too much of the data? Note: columns are page, date, query, position
Contributor
There was a problem hiding this comment. So perhaps we should change it to be a
Author
There was a problem hiding this comment. I don't think changing to The screenshots' first two rows show how the query ranked < 30 one day and > 30 the next day. Again, I think we may be asking too much of the data here. |
||
| FROM google_search_console_blog | ||
| WHERE date < current_date - interval '7 days' | ||
| AND position > 30) | ||
| GROUP BY 1, 2 | ||
| ORDER BY page, total_clicks DESC) | ||
| SELECT DISTINCT | ||
| page, | ||
| LISTAGG(query, ', ') OVER(PARTITION BY page) AS top_5_queries, | ||
| SUM(total_clicks) OVER(PARTITION BY page) AS total_clicks | ||
| FROM (SELECT * | ||
| FROM first_appearance_queries | ||
| WHERE rank <= 5) | ||
| ORDER BY total_clicks DESC | ||
| LIMIT 100; | ||
| ``` | ||
|
|
||
| ## Query Results Dictionary | ||
| Column | Description | ||
| ---|--- | ||
| `page`| The page on your site appearing in search results. | ||
| `top_5_queries`| The five 'first appearance' queries that have generated the most clicks for this page in the last seven days. | ||
| `total_clicks`| The sum of all the clicks that the five queries generated for this page in the last seven days. | ||
| Original file line number | Diff line number | Diff line change |
|---|---|---|
| @@ -0,0 +1,38 @@ | ||
| # Top 5 Most Clicked Queries Per Page In The Last 28 days (Top 100 Pages) | ||
|
|
||
| Instructions | Details | ||
| ---|--- | ||
| Description | For each of the top 100 pages on your site, this query finds the top 5 most clicked queries, and the number of clicks they generated in the last 28 days. | ||
| Requirements | Collect the Panoply Google Search Console data source with the default set of metrics and dimensions. Dimensions used: `date`, `page`, `query`. Metrics used: `clicks`. | ||
| Usage | Create a table to see which keywords rank highly and bring in traffic for each page. | ||
| Modifications | <ul><li><b>Custom number of queries: </b>In the final `FROM` statement, change `WHERE rank <= 5` to `WHERE rank <= N` to get the top N best performing queries per page, for some whole number N.</li> <li><b>Custom date range: </b>Change the first `WHERE` clause to `WHERE date > current_date - interval 'N days'` to get the top 5 best performing queries in the last N days, for some whole number N.</li><li><b>Worst performing queries: </b>Get the top 100 worst performing queries and pages by changing the ORDER BY clause to `ORDER BY total_clicks ASC`.</li></ul> | ||
|
|
||
| ```sql | ||
| WITH page_info AS( | ||
| SELECT | ||
| page, | ||
| query, | ||
| SUM(clicks) AS total_clicks, | ||
| ROW_NUMBER() OVER(PARTITION BY page ORDER BY total_clicks DESC) AS rank | ||
| FROM google_search_console_blog | ||
| WHERE date > current_date - interval '28 days' | ||
| GROUP BY 1, 2 | ||
| ORDER BY page, total_clicks DESC) | ||
| --------------------- | ||
| SELECT DISTINCT | ||
| page, | ||
| LISTAGG(query, ', ') OVER(PARTITION BY page) AS top_5_queries, | ||
| SUM(total_clicks) OVER(PARTITION BY page) AS total_clicks | ||
| FROM (SELECT * | ||
| FROM page_info | ||
| WHERE rank <= 5) | ||
| ORDER BY total_clicks DESC | ||
| LIMIT 100; | ||
| ``` | ||
|
|
||
| ## Query Results Dictionary | ||
| Column | Description | ||
| ---|--- | ||
| `page`| The page on your site appearing in search results. | ||
| `top_5_queries`| The five queries that have generated the most clicks for this page in the last 28 days. | ||
| `total_clicks`| The sum of all the clicks that the five queries generated for this page in the previous 28 days. |
Uh oh!
There was an error while loading. Please reload this page.