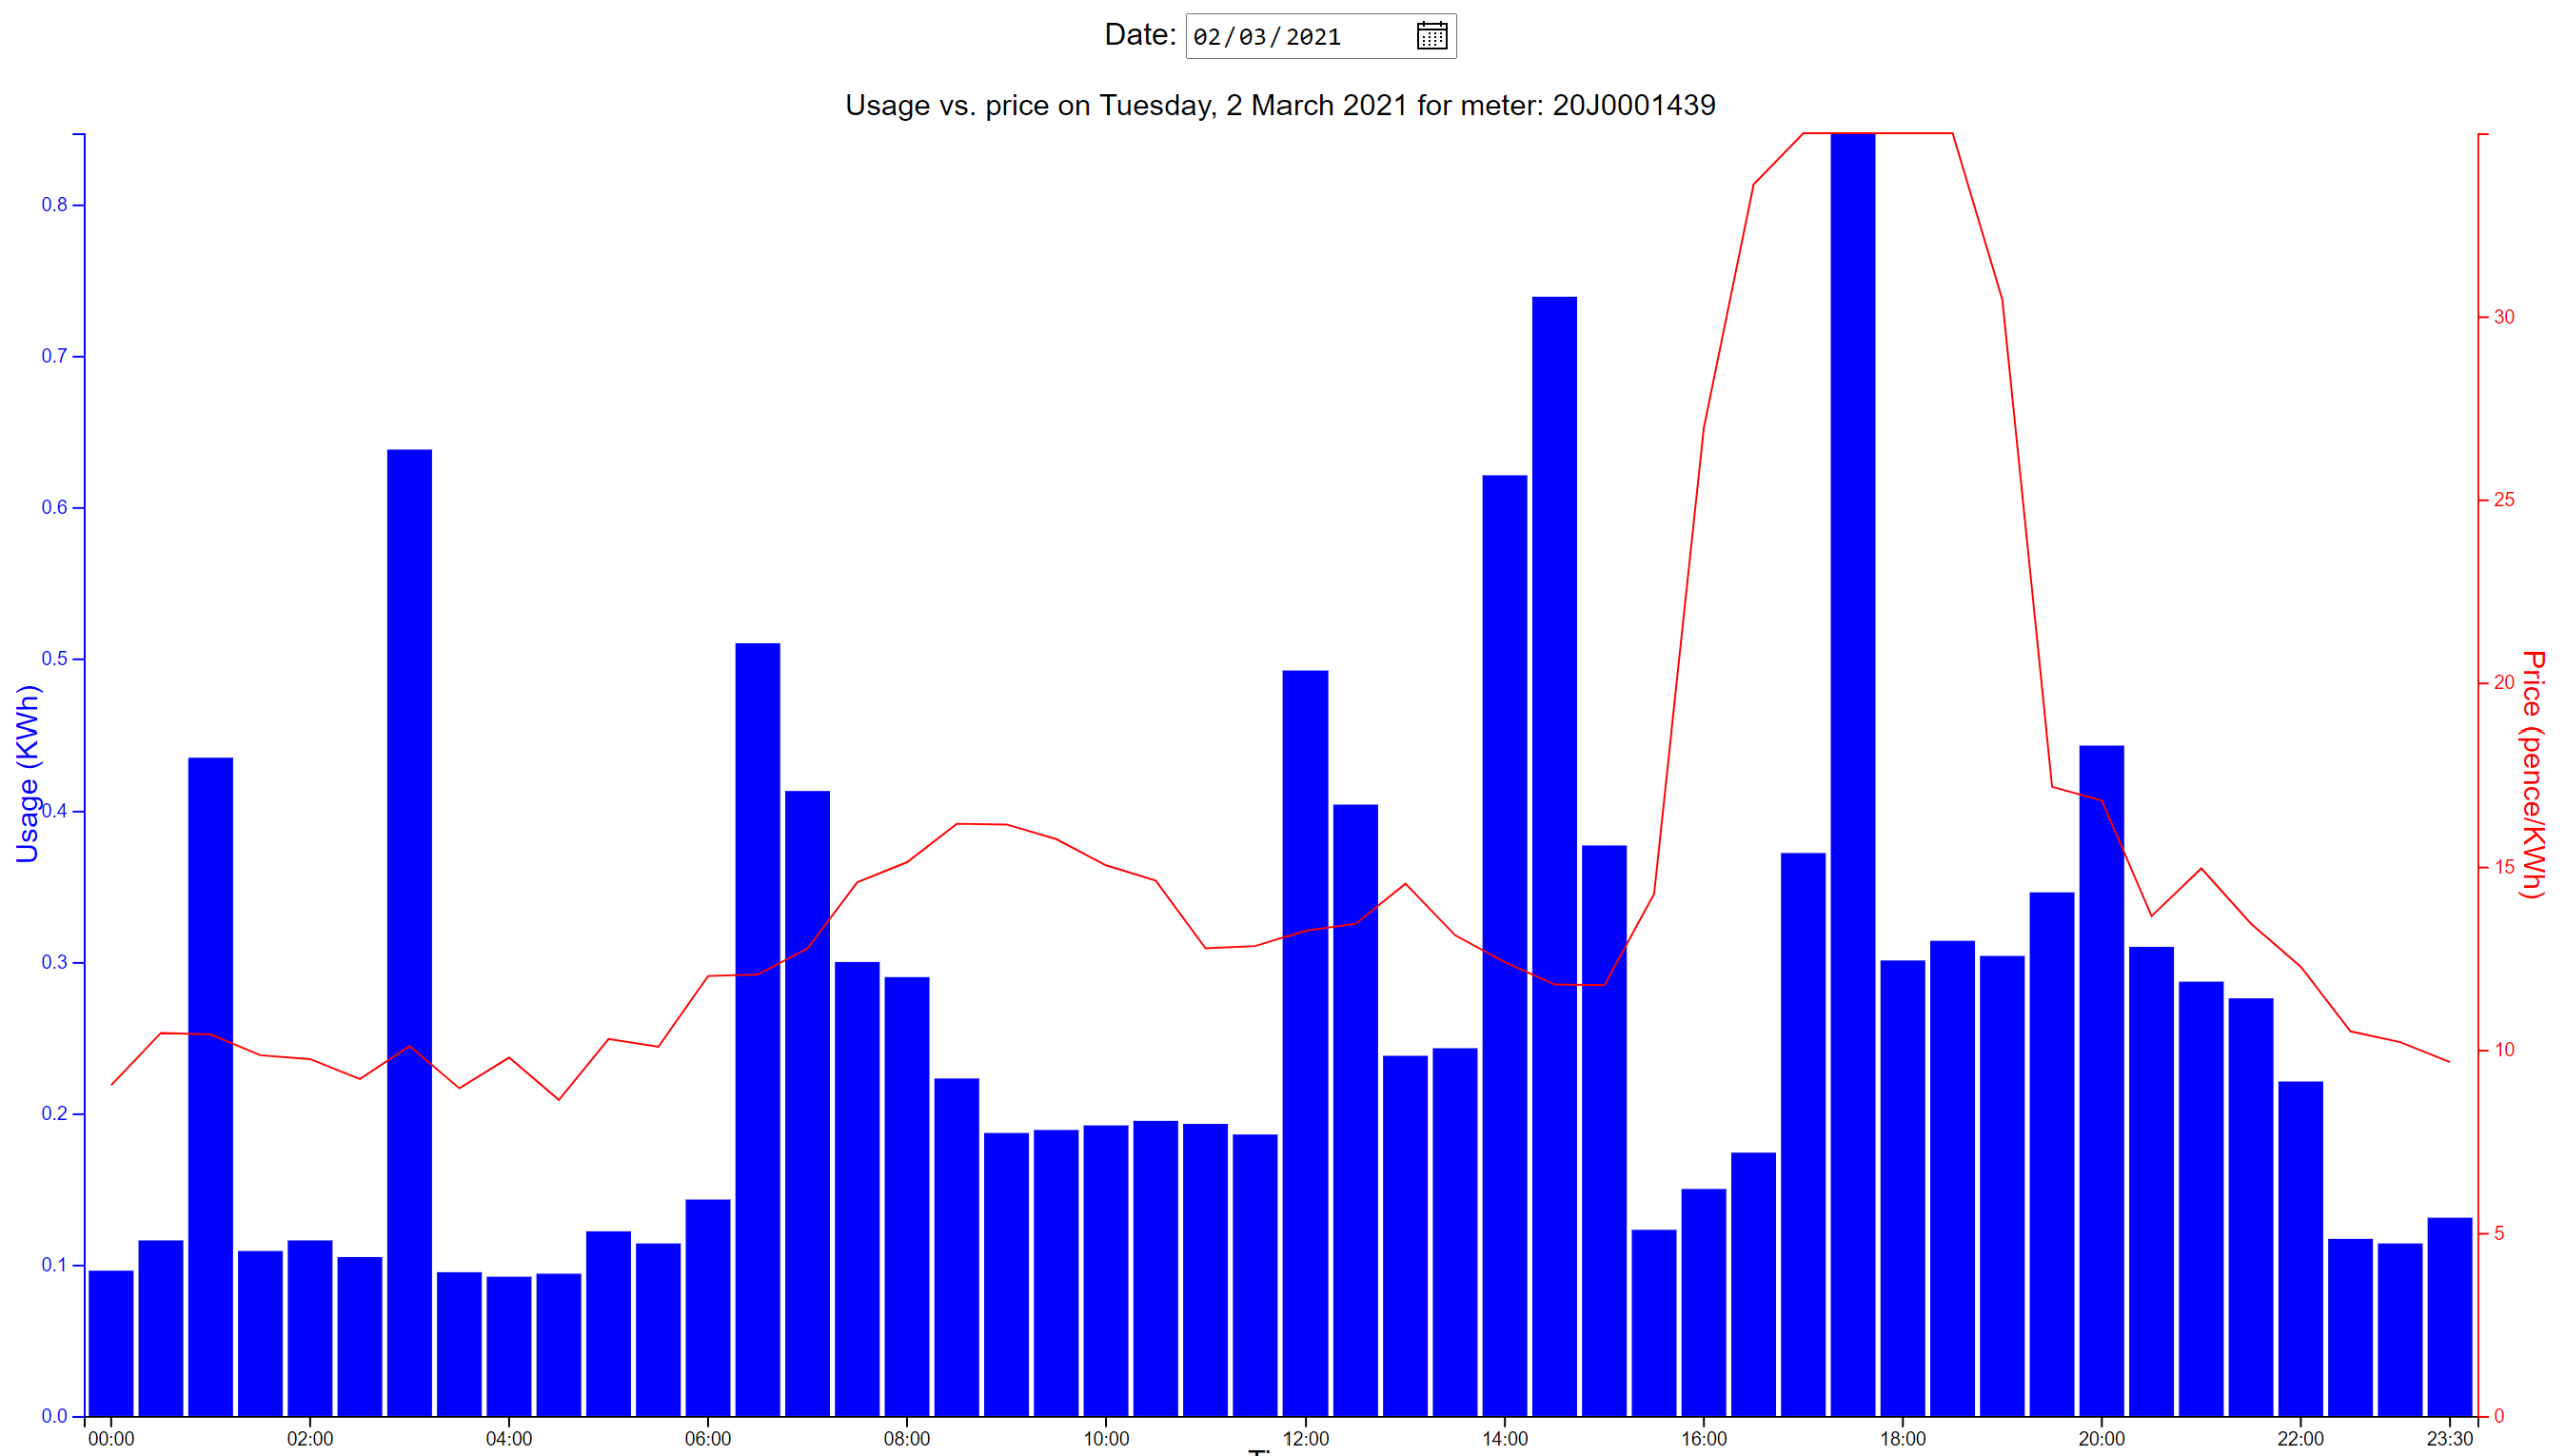
This project uses the D3.js library to show Octopus agile electricity usage verses price for a particular day. All the processing is done client side, apart from two API requests made to Octopus Energy. The API for the usage requires details for the particular meter - these values can be found here: https://octopus.energy/dashboard/developer/
If you are an Octopus Agile customer and want to try it out go here: https://ollyburns.github.io/graph.html
A screen shot example can be found here: https://ollyburns.github.io/ExampleOutput.png