- For easy viewing, you can take a look at the exported HTML file
- When viewing the original Notebook, some images might not be loaded, you need to click on File -> Trust Notebook.
- pandas
- matplotlib
- plotly
- seaborn
- us
- pycaret
- All of the packages above can be installed by pip install
- When install pycaret on Jupyter Notebook, to prevent potential conflict with other Python packages, it is recommended to create a new Conda environment and install Pycaret into it. The detailed installation guide for Pycaret can be found at https://pycaret.org/install/
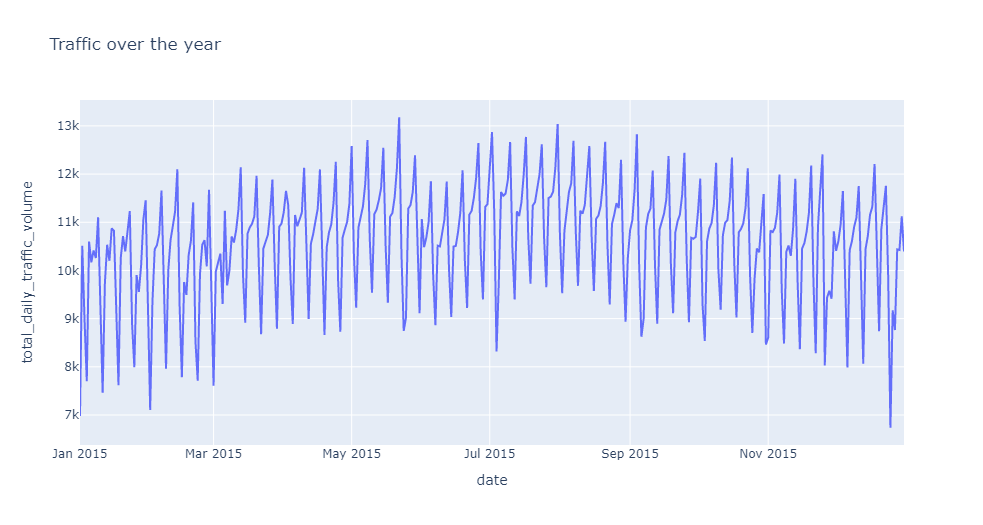
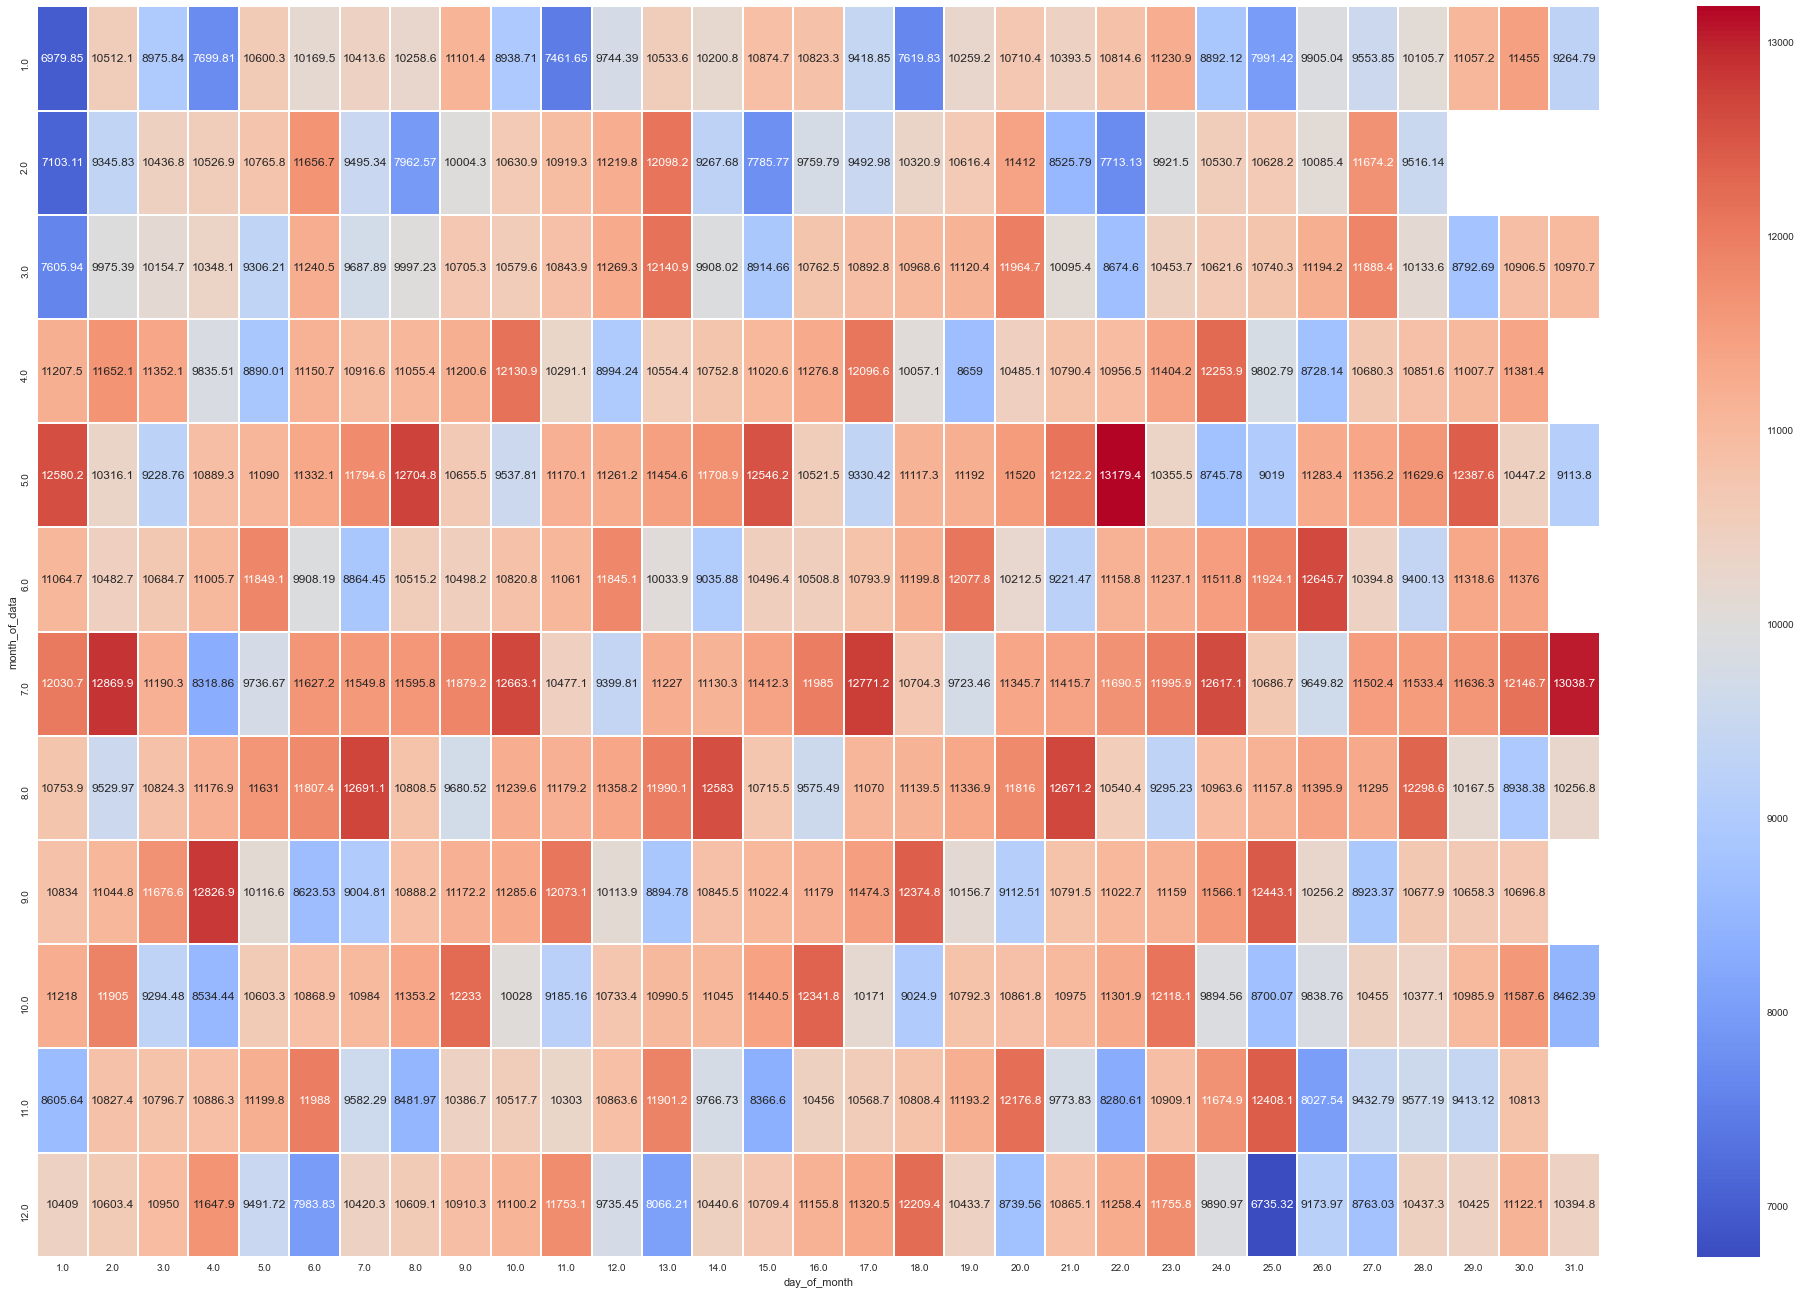
The dataset can found be found at https://www.kaggle.com/jboysen/us-traffic-2015. Due to size constraints, the data files cannot be included in this repository