![]()

VisuSat is a Python toolkit for visualising, handling and processing satellite and oceanographic data, with dedicated pipelines for :
- EUMETSAT Data Store & Data Tailor
- Copernicus Marine Service (CMEMS)
It provides high-level wrappers around eumdac, copernicusmarine, xarray,
and advanced visualisation utilities using cartopy and matplotlib.
📘 Full documentation: https://visusat.readthedocs.io/en/latest/
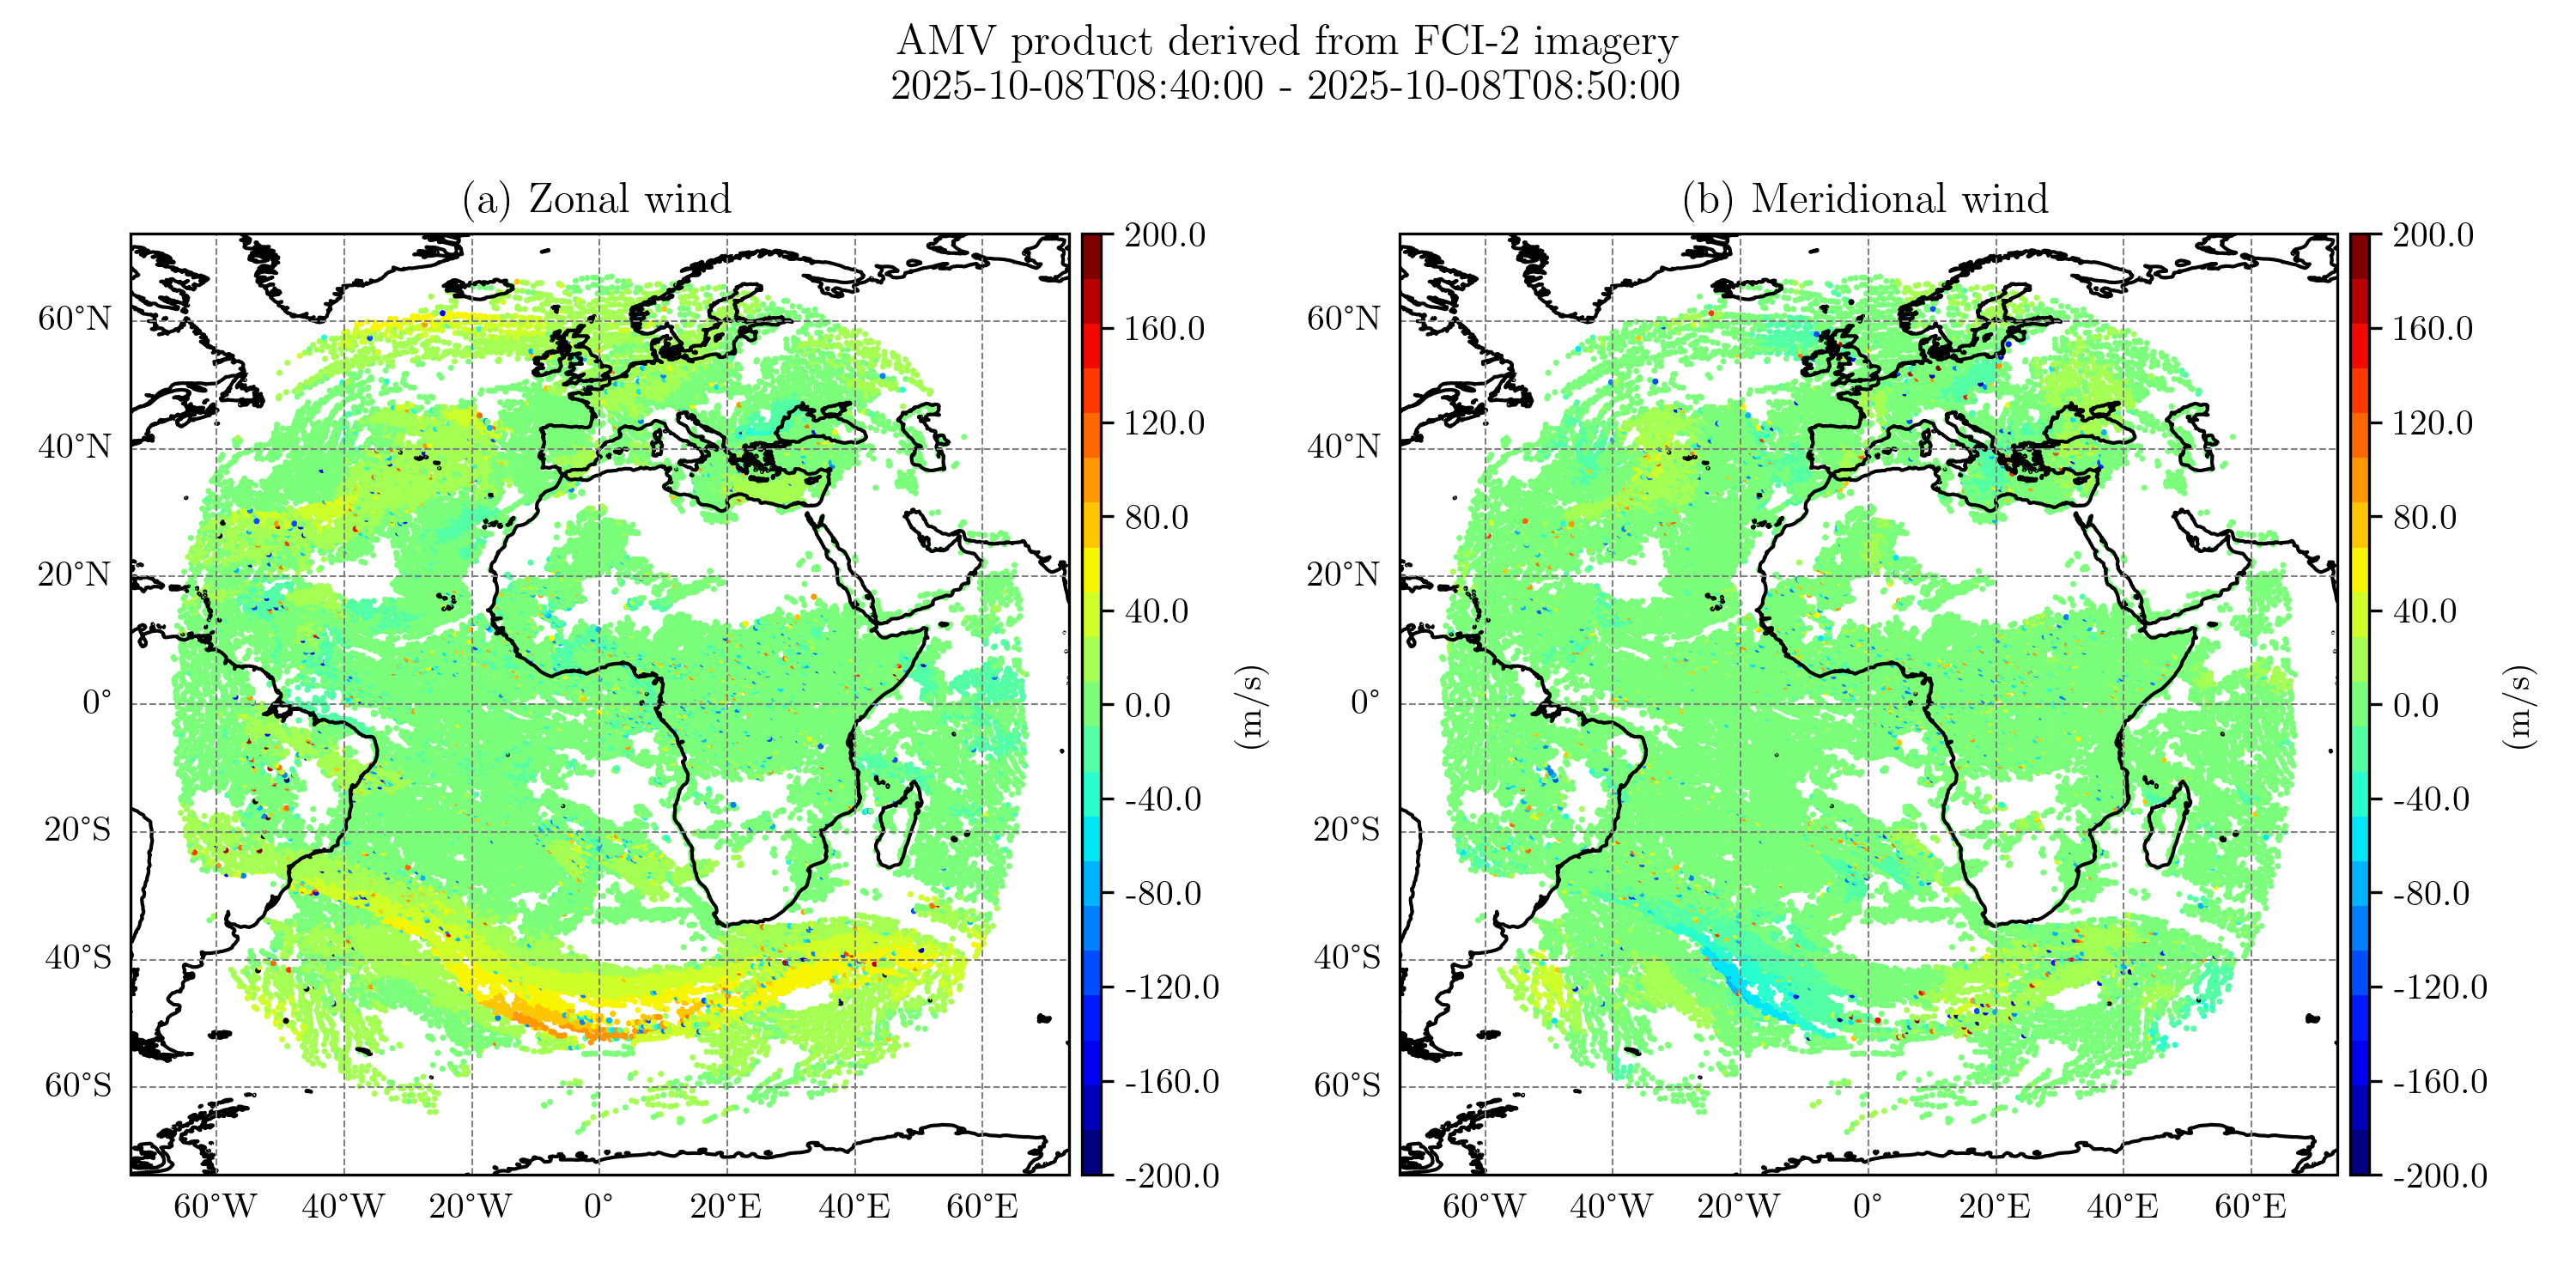
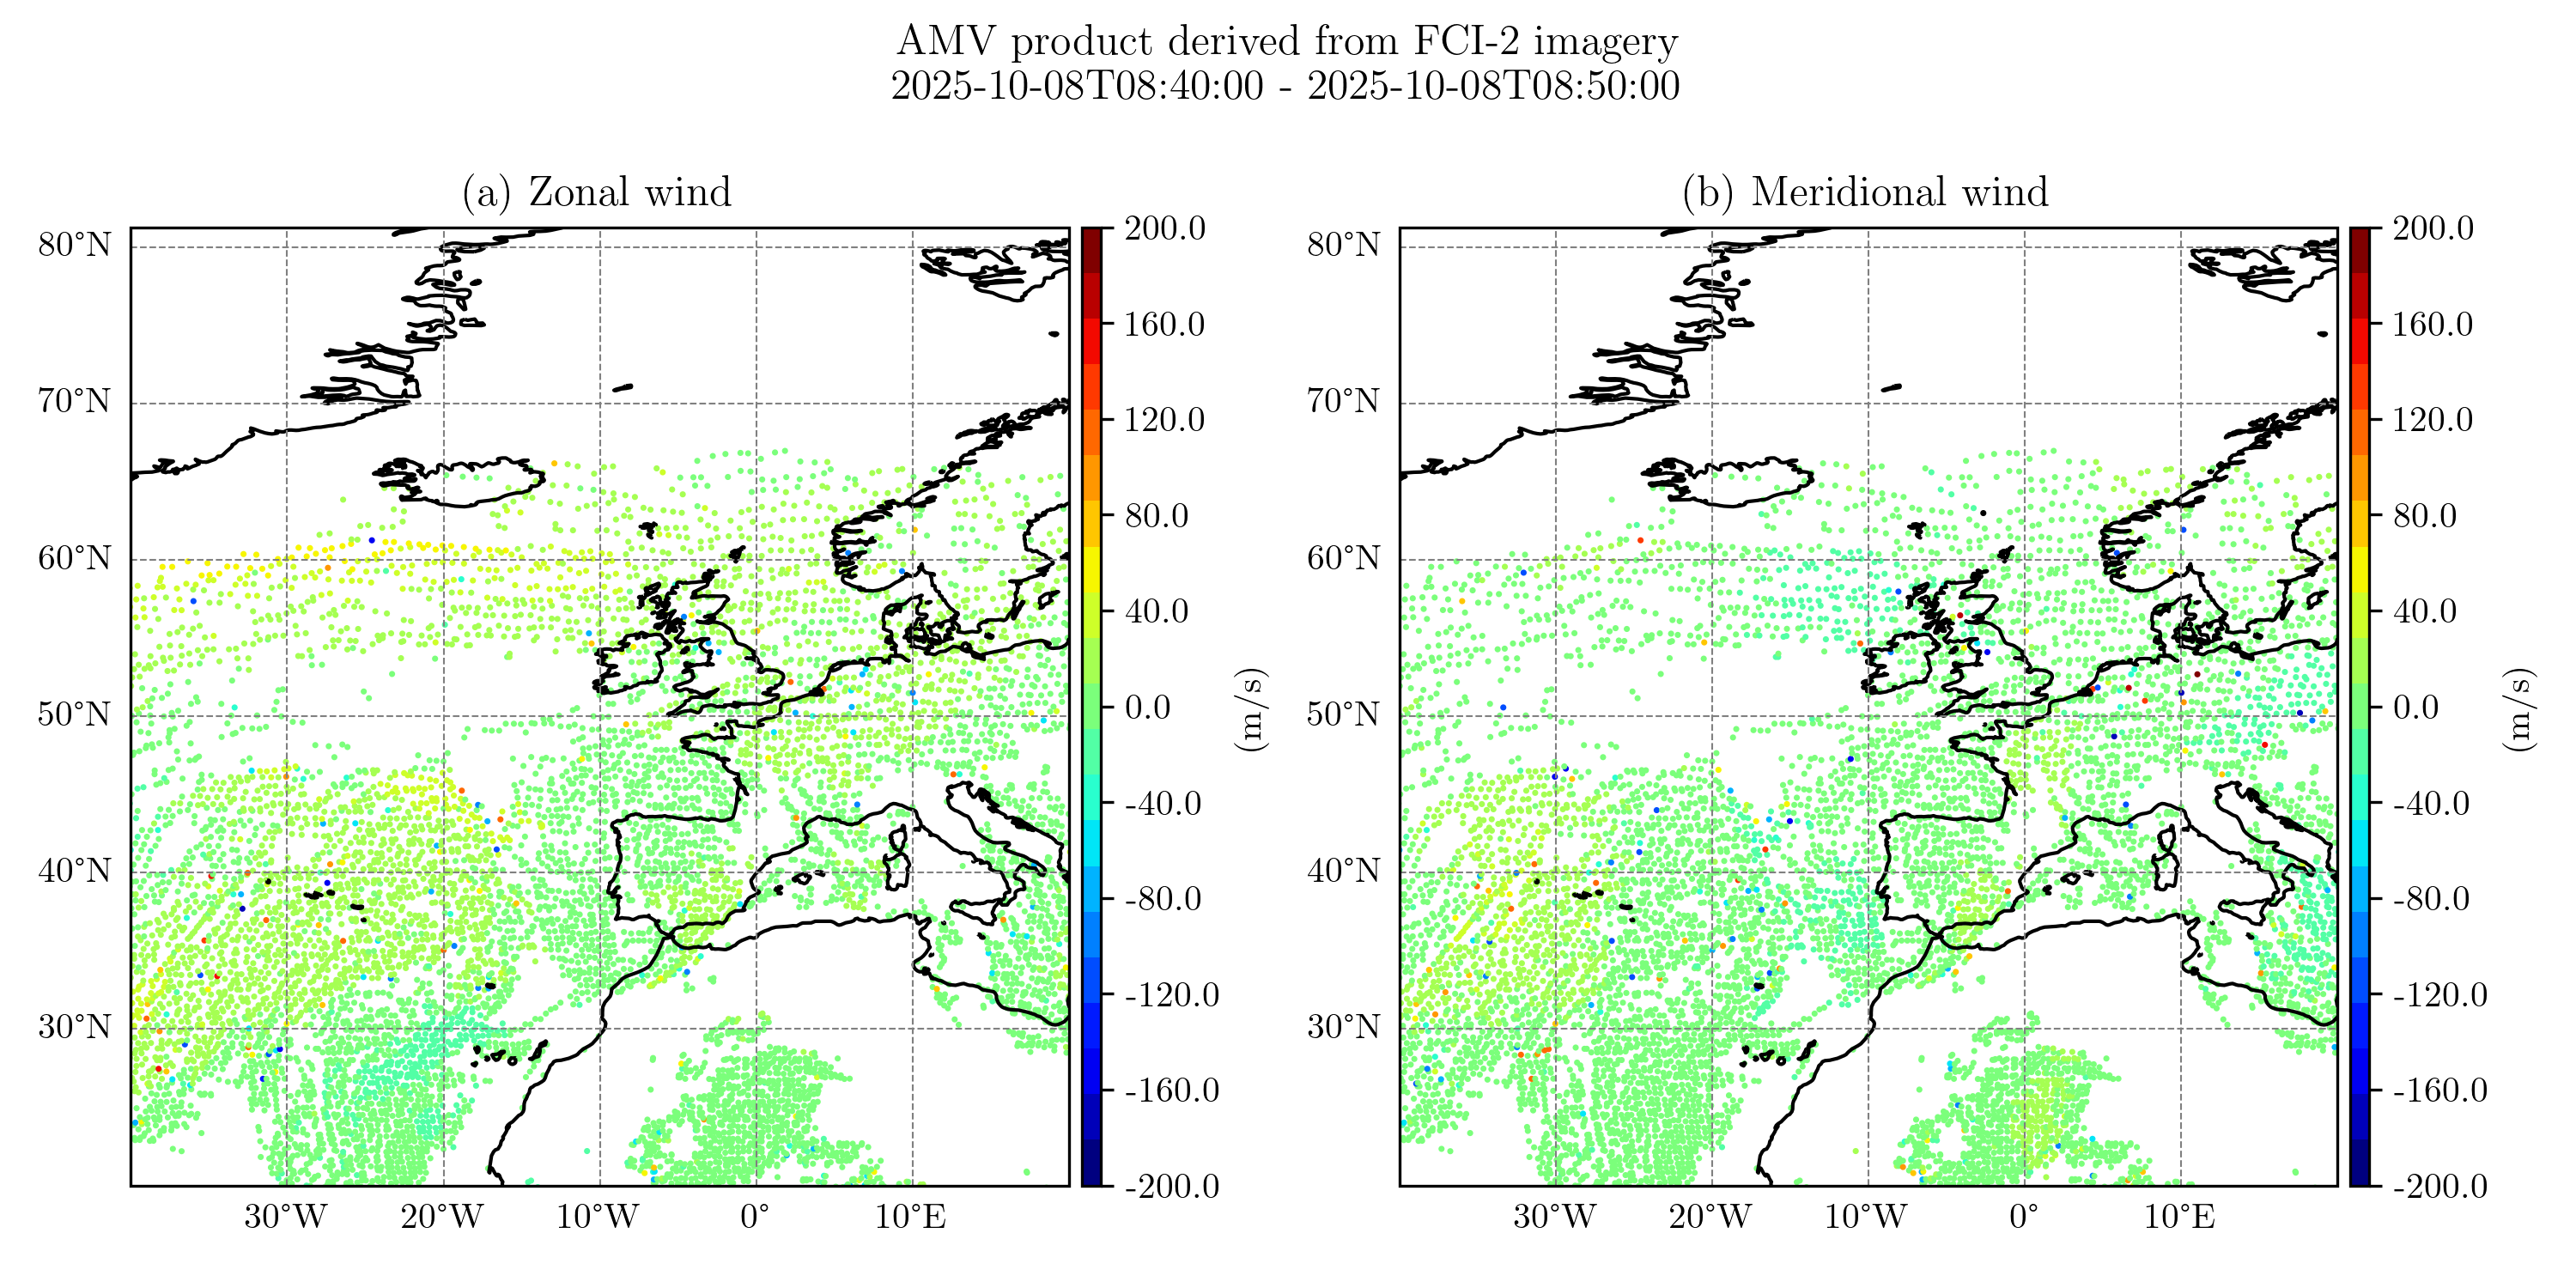
Derived from MTG-FCI Level 2 wind products :
Effective radiance from Visible 0.6µm channel, over Western Europe, between 12UTC and 16UTC the 22/10/2025. Product : FCI L1c High Resolution Image Data - MTG
The 0.6 µm visible channel of MTG FCI is a solar-reflectance channel that is sensitive to surface albedo, clouds (primarily their upper layers), and aerosols. Oceanic and continental surfaces tend to absorb most of the incoming solar radiation, leading to low radiances (dark tones), whereas clouds and aerosols reflect sunlight efficiently, resulting in high radiances (bright tones). In this image, the Benjamin depression is visible over the Atlantic Ocean and is characterized by a vortex-shaped pattern of enhanced radiances associated with thick cloud structures.
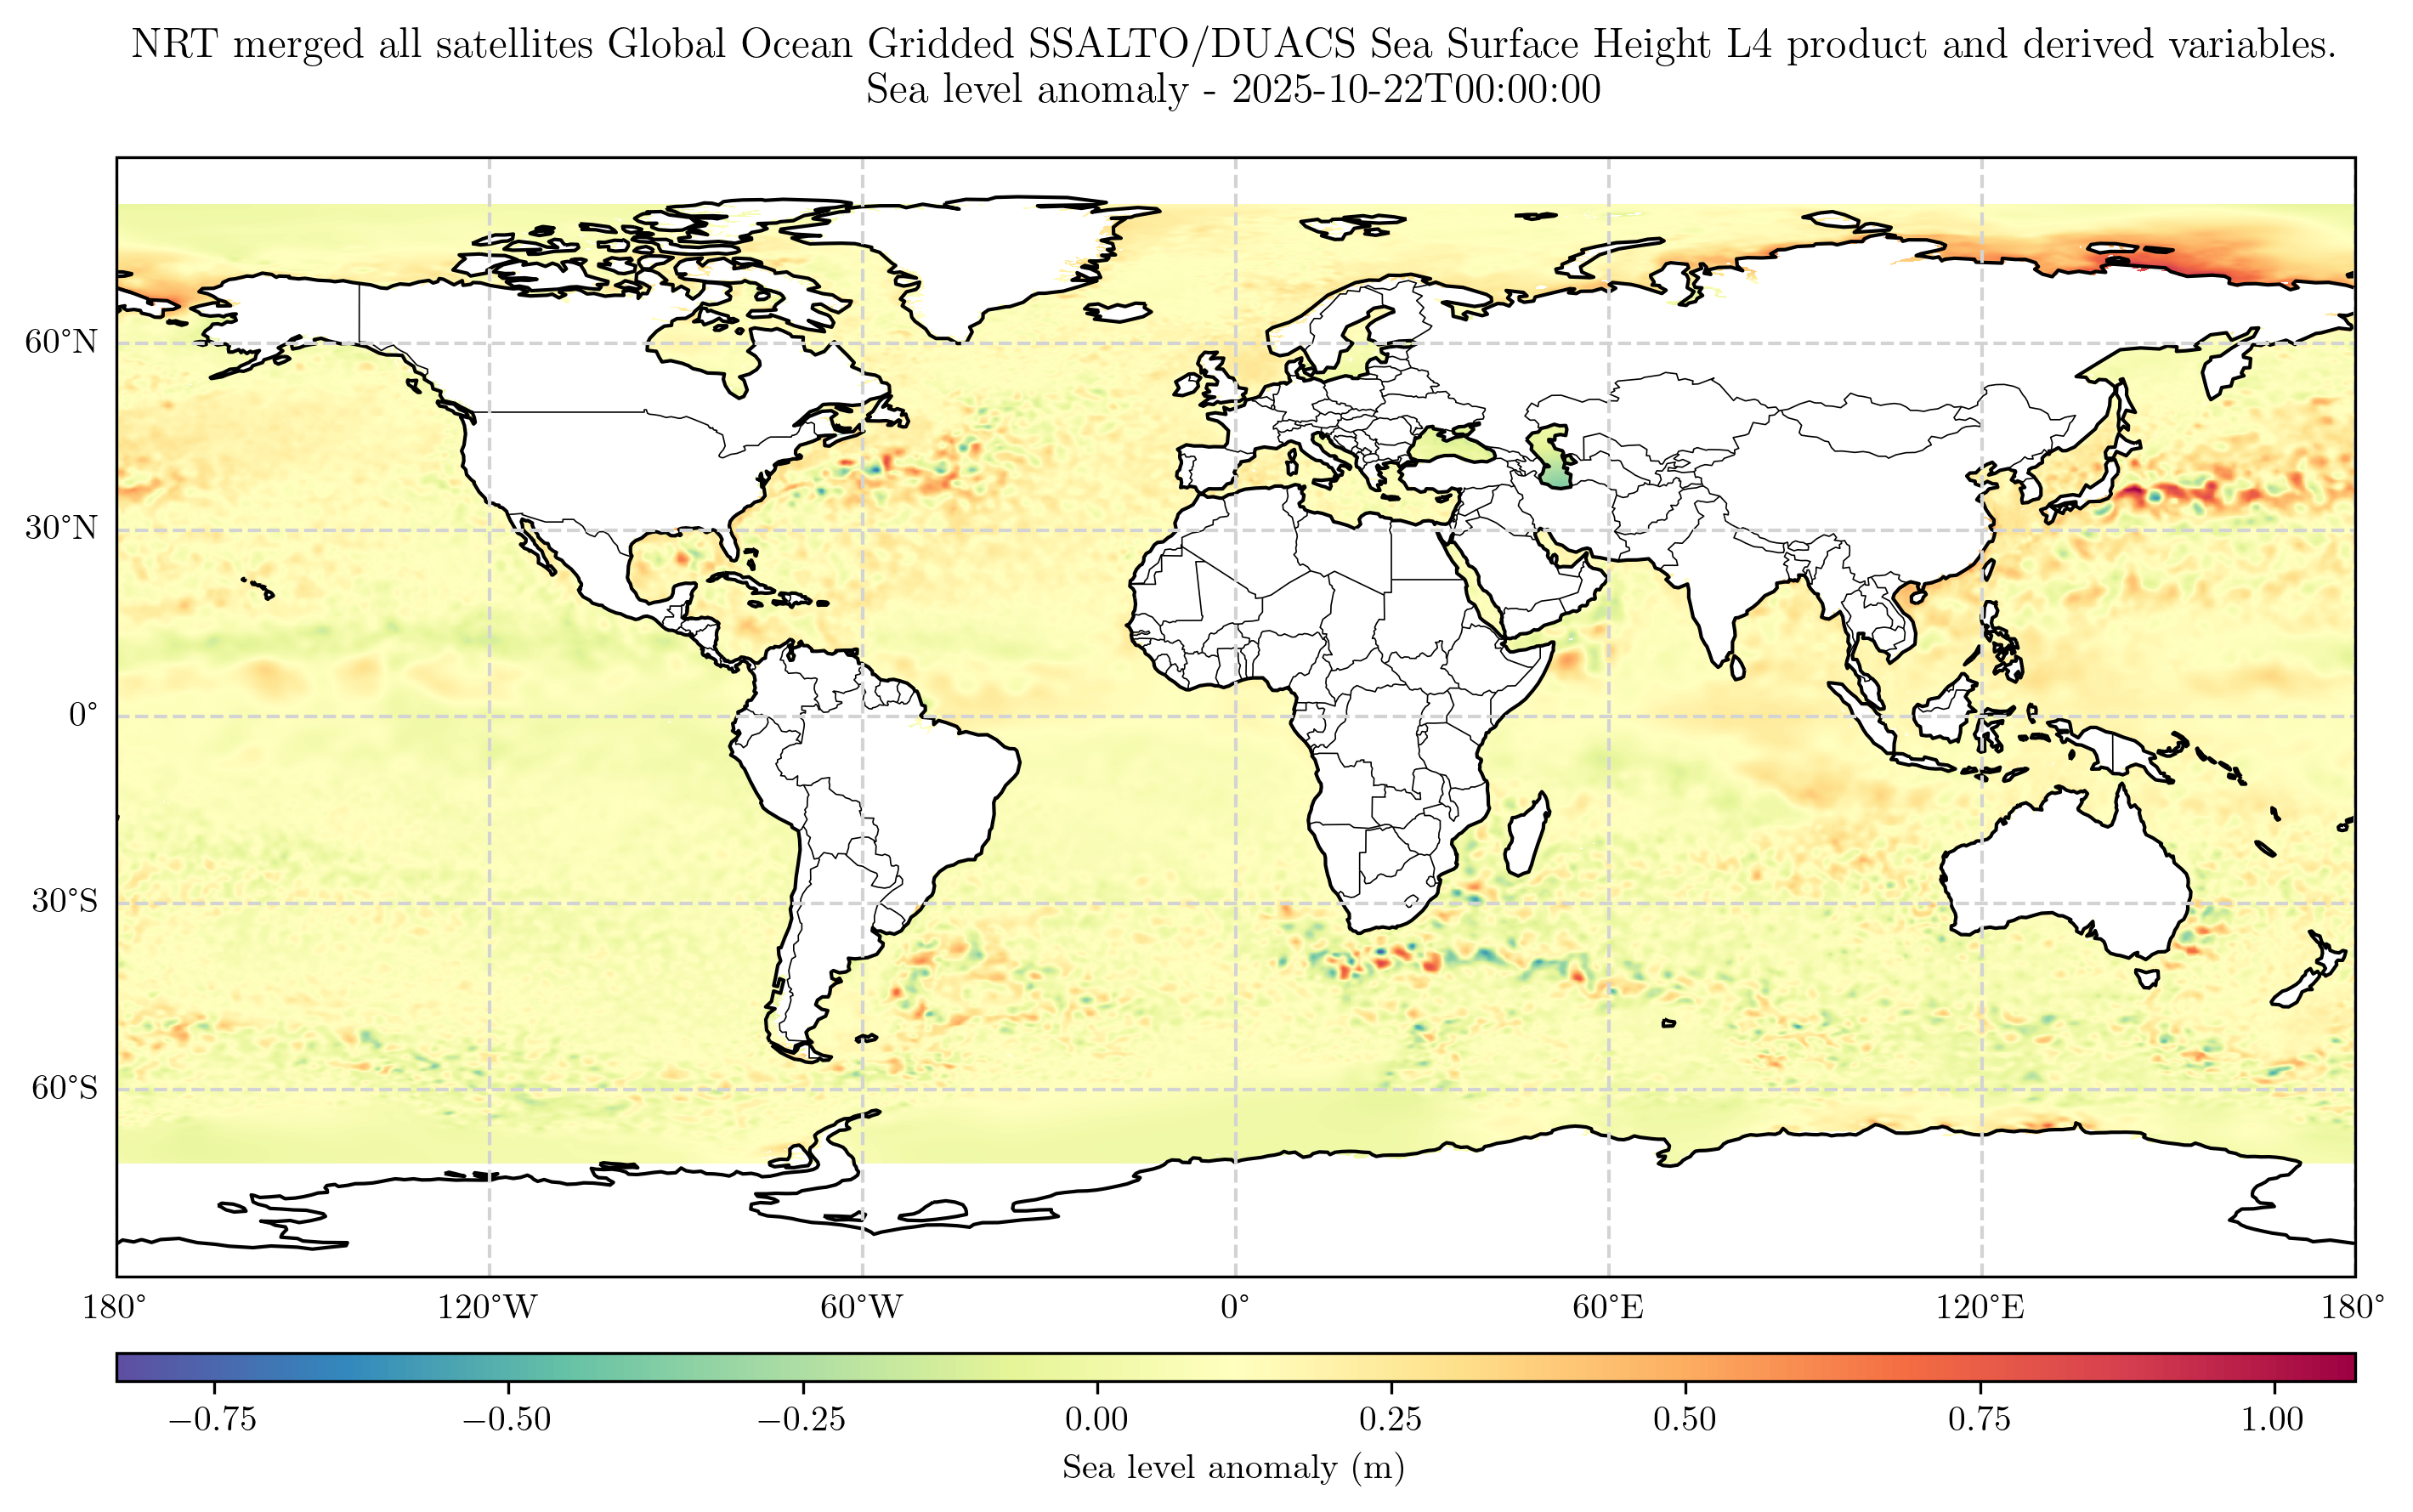
Allows to download and visualize available datasets from Copernicus Marine datastore (https://data.marine.copernicus.eu/products).
Example of the the Sea Level Anomaly (in meter) from an aggregate of all available satellites data into Global Ocean Gridded Level4 product (link) :
Product: SEALEVEL_GLO_PHY_L4_NRT_008_046
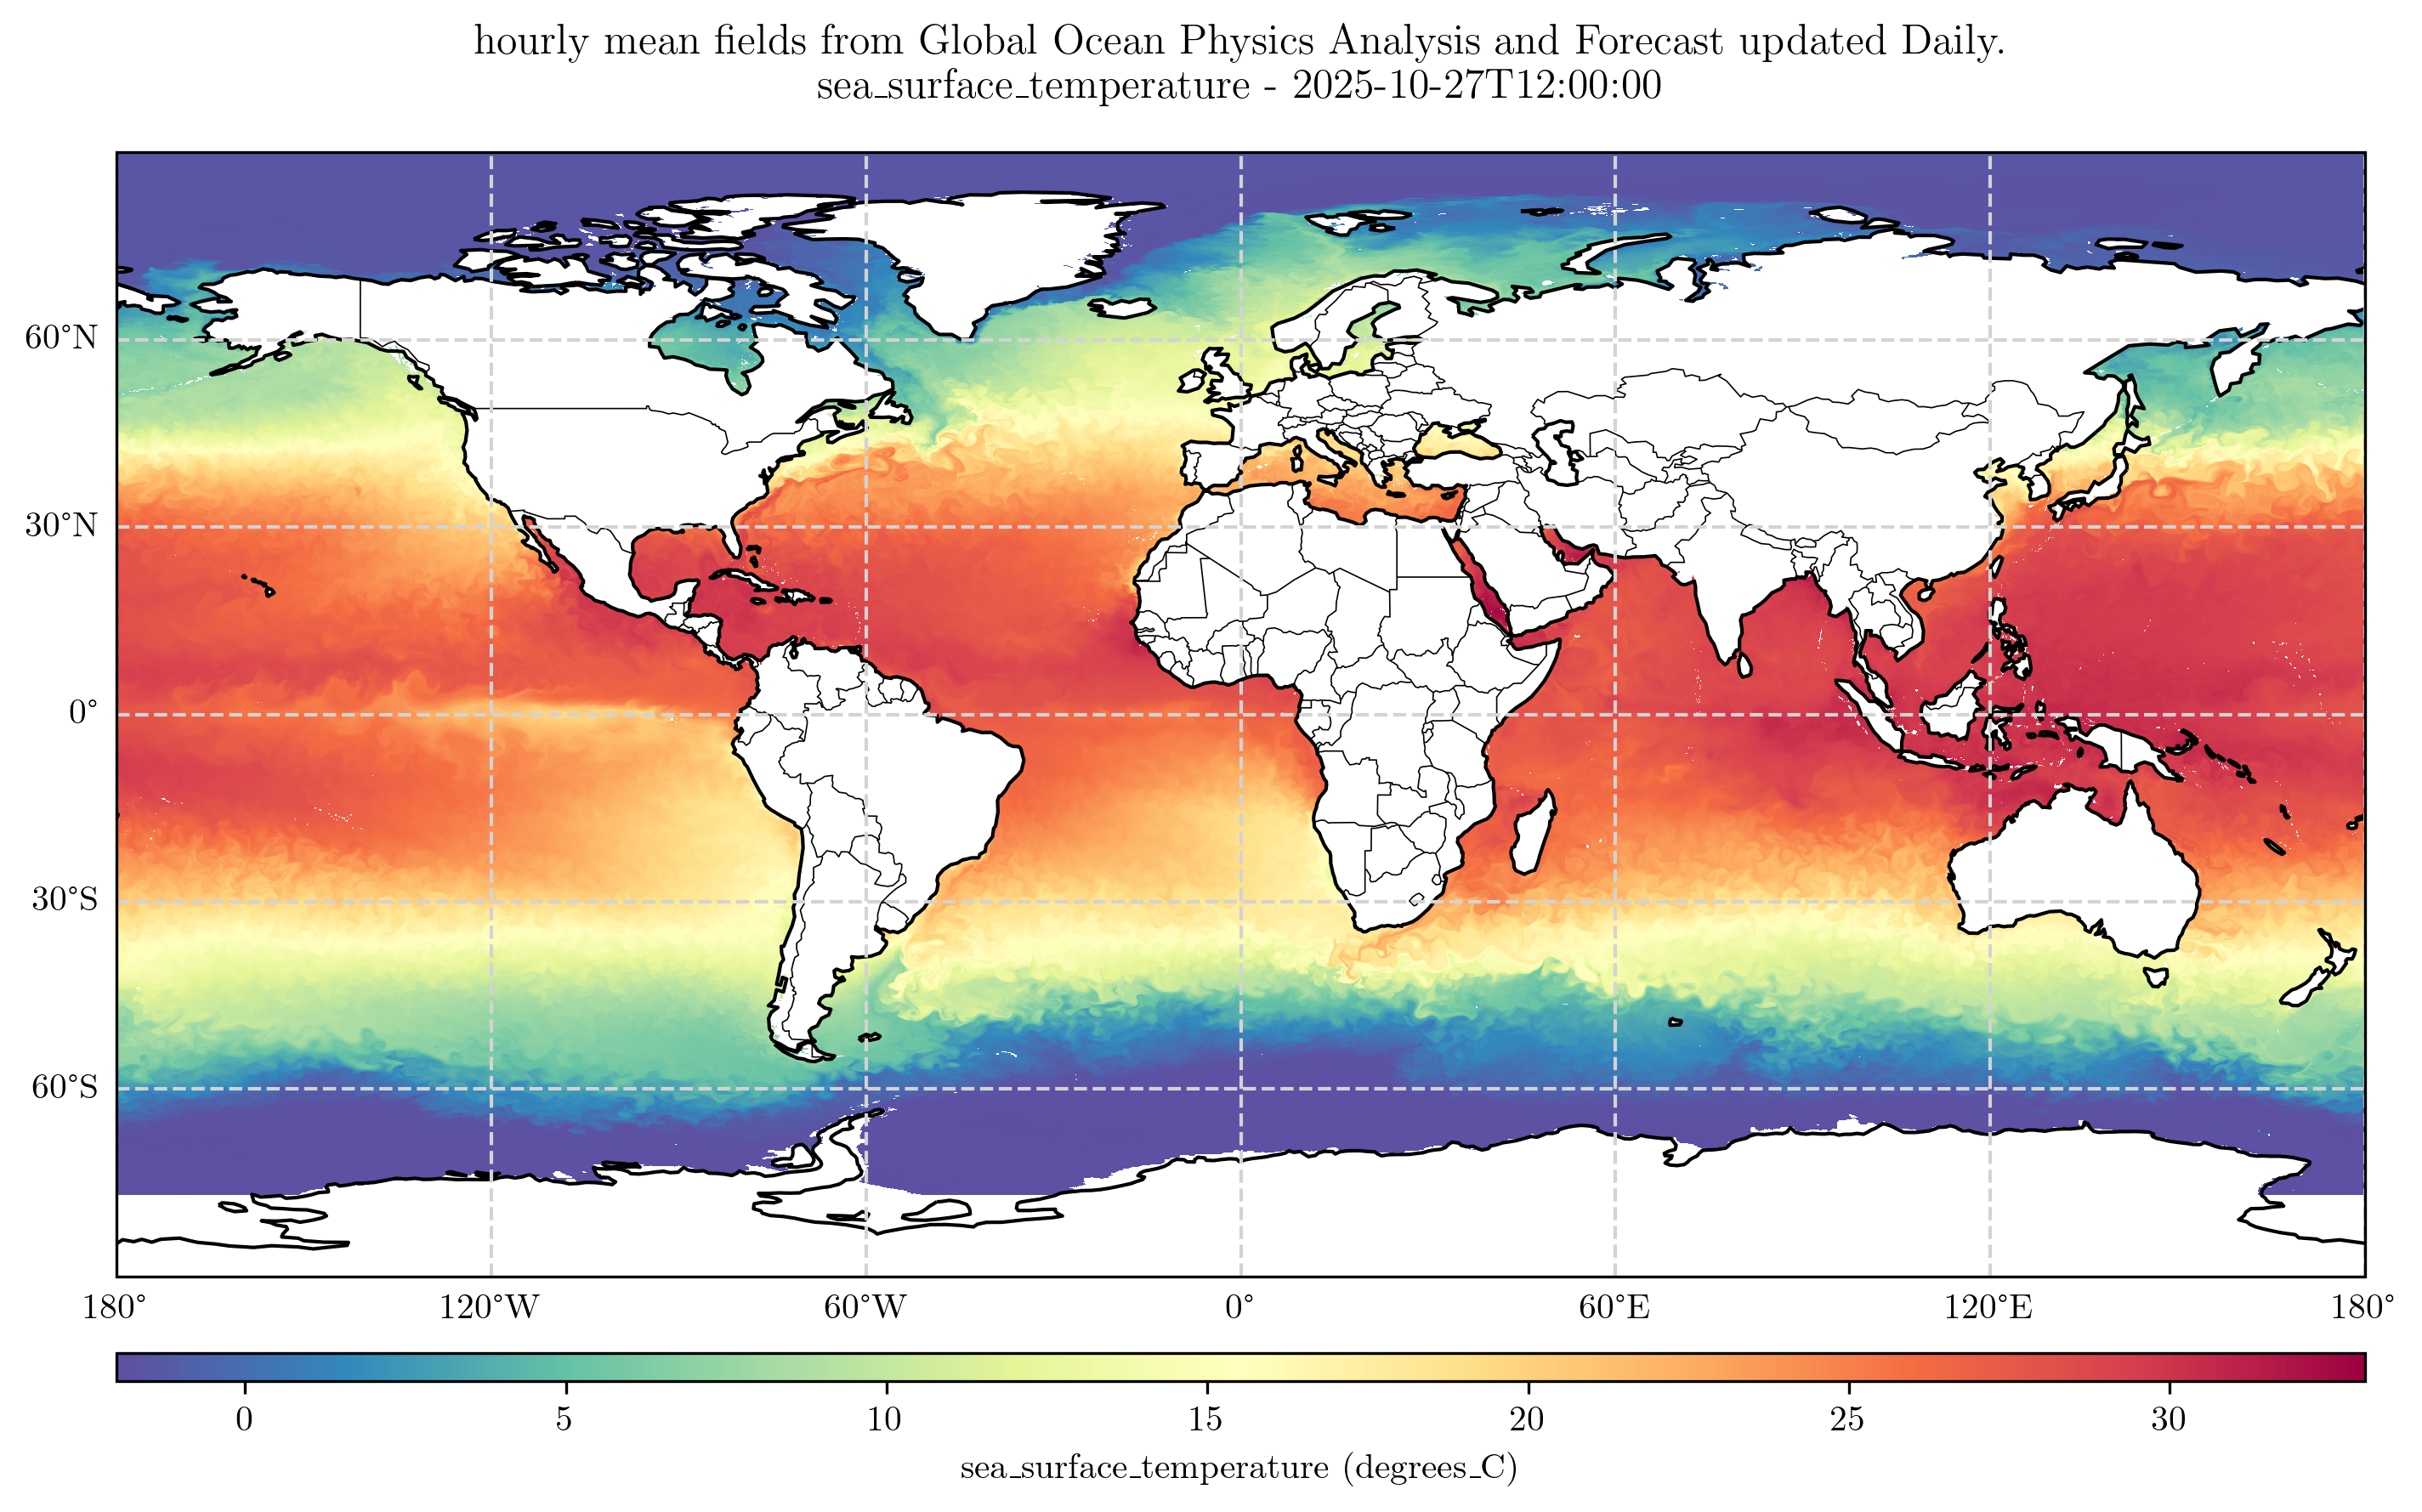
Hourly Sea Water Potential Temperature —
Product: GLOBAL_ANALYSISFORECAST_PHY_001_024
VisuSat is available on PyPI:
pip install visusatFor devellopment :
git clone https://github.com/nsasso56-cell/VisuSat
cd VisuSat
pip install -e .pip install --upgrade visusatHere is a minimal example showing how to download and plot a Copernicus Marine dataset:
from visusat import copernicus

request = copernicus.CopernicusRequest(
    dataset_id="cmems_obs-sl_glo_phy-ssh_nrt_allsat-l4-duacs-0.125deg_P1D",
    variables=["sla", "err_sla"],
    minimum_longitude=1,
    maximum_longitude=359,
    minimum_latitude=-70,
    maximum_latitude=80,
    start_datetime="2025-10-22T00:00:00",
    end_datetime="2025-10-22T00:00:00",
    output_filename="duacs_sla.nc",
)

ds = copernicus.load_dataset(request, force=False)

# Plot all fields
copernicus.plot_fields(request, ds)

# Plot surface currents
copernicus.plot_currents(request, ds, vectors = False)
More examples are available in the examples/ folder.
- High-level wrappers for Copernicus Marine API
- Automation of EUMETSAT Data Tailor workflows
- Built-in plotting functions (AMVs, radiances, currents…)
- Utilities for generating animated visualizations of satellite data.
- Dataset registry and metadata helpers
- Strong logging system
- Full Sphinx documentation (ReadTheDocs)
VisuSat/
├── pyproject.toml
├── README.md
├── src/
│   └── visusat/
│       ├── copernicus.py
│       ├── eumetsat.py
│       ├── utils.py
│       ├── plotting.py
│       └── eumetsat_products_registry.py
├── docs/
│   └── source/
├── examples/
│   ├── demo_copernicus_globmodel.py
│   ├── demo_eumetsat_datatailor.py
│   ├── demo_eumetsat_animation.py
│   └── images/
└── data/
    ├── copernicus/
    └── eumetsat/
Author : Nicolas SASSO.
- e-mail : n.sasso56@gmail.com
- LinkedIn : linkedin.com/in/nicolas-sasso-6356ab172
Distributed under the MIT License.