GNU Terry Pratchett -Ook

Please note this is not a finished project and it still has a lot of refining and cleaning up as well as expanding to be done. there is a live feedback system thats in the process of being integrated into the Squiggle Interpreter as well as a Report generator that was in the early build. any ideas on what else to add are always welcome and I hope this is of use to those who are interested in this sort of thing.
The Squiggle Interpreter is an open-source EEG/qEEG analysis platform designed to bridge clinical, research, and industry standards. Developed by EL Chaderino/VocalARR, this tool is intended to empower users by providing a transparent, customizable, and extensible solution for advanced EEG data processing. Unlike black-box systems, The Squiggle Interpreter exposes its inner workings—allowing users to verify, modify, and expand its capabilities.
https://mne.tools/stable/index.html
- Overview
- Key Features
- Architecture and Modules
- Clinical, Research, and Industry Standards
- Installation and Setup
- Usage
- Extensibility and Customization
- Contributing
- License
- Authors
- References
The Squiggle Interpreter is built to analyze EEG data in EDF format and generate a wide array of visual and quantitative outputs. It integrates advanced signal processing techniques with state-of-the-art source localization, time-frequency analysis, and clinical metrics computation. By providing a modular design and detailed logging, the tool serves as a transparent "glass-box" platform that can be audited, enhanced, and integrated with other tools.
-
EEG Data Grouping and Preprocessing
Scans directories for EDF files and automatically groups by subject and condition (EO/EC). Applies standard montages and referencing. Optional CSD support for enhanced surface mapping. -
Band Power Analysis
Computes absolute and relative band power for Delta, Theta, Alpha, SMR, Beta, and High Beta bands. -
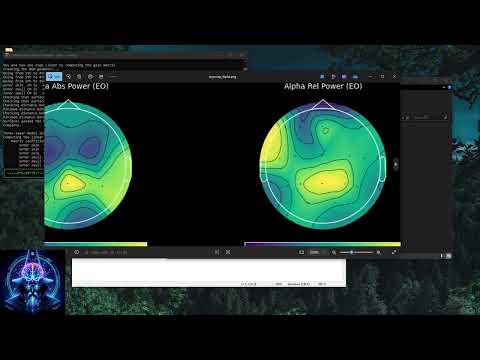
Topographic Mapping
Creates global topomaps (absolute and relative) for each frequency band. Dark-mode styled for publication-quality output. -
Waveform and ERP Visualization
Generates global waveform grids and pseudo-ERP plots to show signal characteristics. -
Coherence and Z-Score Analysis
Creates coherence matrices and robust z-score topomaps based on clinical norms. -
Time-Frequency Representation (TFR)
Computes TFRs using Morlet wavelets to visualize dynamic spectral activity. -
ICA Component Visualization
Plots independent components to help identify and reject artifacts. -
Source Localization
Uses forward and inverse modeling (LORETA, sLORETA, and eLORETA) to map EEG signals onto 3D brain surfaces. -
Vigilance Detection
Provides epoch-level vigilance classification using Alpha/Theta ratios.
Includes hypnograms and colored vigilance strips representing states A1–C.
Useful for fatigue tracking, insomnia detection, attention profiling, and pre-sleep patterning.
(Currently under construction. Inspired by Jay Gunkleman.) -
Clinical Metrics and Detailed Reports
Calculates Alpha percentage shifts, Theta/Beta ratios, and other metrics.
Compiles all visualizations and metrics into a unified, interactive HTML report.
🔄 Recent Updates 🧠 Vigilance Module (inspired by Jay Gunkleman) Classifies vigilance levels based on Alpha/Theta ratios.
Produces hypnogram plots and colored vigilance strips.
Integrated into reports for assessing arousal stability and attentional regulation.
⚡️ Current Source Density (CSD) (inspired by Jay Gunkleman) Adds Laplacian-transformed visualization via MNE-Python's CSD.
Enhances topomap sharpness and visual clarity.
Toggle-able during preprocessing for visualization only.
📈 Canonical Discriminant Analysis (CDA) Prep (inspired by Jay Gunkleman) Backend now splits signals for CDA and source localization independently.
Generates CDA-compatible outputs for regional activation comparison.
Scaffolded for future CDA classifier development and group statistics support.
📊 Enhanced Robust Z-Score Computation (inspired by Jay Gattis) Supports three z-score methods:
Standard (mean/std)
Robust using MAD (with iterative outlier rejection)
Robust using IQR
Offers an option to use published clinical norms (e.g., adult Cuban qEEG values) for clinically validated z-scores.
🔍 Clinical Outcome Integration (inspired by Jay Gattis) Integrates clinical outcome data (loaded from CSV or dummy fallback) to compare and validate z-score methods via Pearson correlations.
Facilitates direct assessment of which normalization method best correlates with clinical measures.
🔗 Coherence Matrix Visualization Computes frequency-specific coherence matrices and visualizes them as heatmaps for both conditions (EO and EC).
Provides a comprehensive view combining local power abnormalities (via z-score topomaps) and inter-channel connectivity (via coherence analysis).
🧭 Source Localization Enhancements Added conditional referencing logic for forward modeling.
Supports flexible referencing for inverse solutions.
Generates visualizations per condition, frequency, and localization method.
###New Features and Enhancements
Comprehensive Clinical Reporting
Detailed Reports: Generates comprehensive clinical reports in multiple formats (text, CSV, and interactive HTML) that now integrate the new pyramid model mappings.
Pyramid Model Integration
Differentiated Mappings: Incorporates differentiated and vigilance-enriched clinical mappings (Pyramid Levels 1–5) for refined clinical interpretations for each EEG channel.
Pyramid Mapping Module (pyramid_model.py):
Provides the data structures and functions needed to map EEG metrics to clinical interpretations.
Supports various levels based on EEG patterns and cognitive/behavioral indicators:
Optimal
Mild Deviation
Moderate Disruption
Severe Dysregulation
Pathological
EDF-to-CSV Conversion Module (data_to_csv.py) Detailed CSV Exports: Exports detailed EDF data metrics (both channel-level and time-based) into CSV format.
Command-Line Integration: Integrated into the CLI via a new flag (--csv), along with parameters for specifying:
EDF file path
Epoch length
Output CSV file path
Enhancements to the Main Pipeline (main.py) Command-Line Interface Improvements:
Interactive Prompts: Now prompts for missing parameters such as:
Current source density (CSD) usage (--csd)
Z‑score normalization method (--zscore)
Option to generate a full clinical report (--report)
CSV Export Functionality: Users can export EDF data metrics to CSV by using the --csv flag with the required arguments.
Pathlib Integration: Updated to use Python’s pathlib for improved support of filenames with spaces.
Improved EDF Grouping: Enhanced grouping of EDF files by subject based on consistent filename conventions.


Video old concept scripts in action
Video old batch run in action
The Squiggle Interpreter is organized into several modules:
-
io_utils.py
Contains utilities for scanning directories for EDF files, grouping them by subject, and loading the raw EEG data with standard preprocessing. -
processing.py
Implements advanced signal processing functions, including:- Band power calculation
- Robust z-score mapping
- Coherence computation
- Time-frequency analysis
- Source localization (inverse operator computation and source estimate application)
-
plotting.py
Provides visualization routines for:- Topomaps (absolute & relative power)
- Waveform grids
- Coherence matrices
- Time-frequency representations (TFR)
- ICA component plots
- Source localization images
All plots are optimized for dark mode.
-
clinical.py
Computes clinical metrics on a per-channel basis and generates detailed plots for each site (PSD overlays, waveform overlays, and difference plots). -
report.py
Uses Jinja2 to build an interactive HTML report that integrates all visualizations and metrics into one comprehensive document. -
main.py
Serves as the main execution script, orchestrating the reading of EEG data, processing, visualization, and report generation. It also includes a live EEG display simulation for real-time feedback.
Each module is designed to be self-contained yet interconnected, following industry best practices for modularity, documentation, and testability.
-
Clinical Standards
The platform applies standard EEG montages (10-20 system), average reference projection, and standardized frequency bands. Computed metrics (e.g., Theta/Beta ratio, robust z-scores) align with widely accepted clinical practices. -
Research Standards
Advanced techniques such as source localization (LORETA variants), time-frequency analysis using Morlet wavelets, and coherence analysis are implemented based on current academic literature. This transparency ensures that researchers can validate and extend the methodologies. -
Industry Standards
Designed for scalability and reproducibility, the tool leverages robust libraries like MNE-Python and adheres to open-source principles. Its modular design facilitates integration into larger workflows and commercial pipelines if needed.
mne: For EEG data processing and source localization.
numpy: For numerical computations.
scipy: For signal processing routines.
matplotlib: For all plotting and visualization.
jinja2: For HTML report generation.
rich: For the live command-line display.
nolds: For detrended fluctuation analysis (DFA).
antropy: For entropy and complexity measures.
pandas: For handling clinical metrics and CSV outputs.
Quick and dirty Windows install
Downoad the zip extract the folder to your desktop and then double click on the setup.bat and then follow along from the prepare you files and run in cmd in the project directory python main.py
Install Python: Download and install Python 3.x (I used Python 3.10)
from: https://www.python.org/downloads/
Download the Project:
Download the project ZIP file from GitHub and extract the folder to your desktop.
Prepare Your EDF Files: Place your EDF files into the project folder. Make sure the filenames include "eo" (or "EO") for Eyes Open and "ec" (or "EC") for Eyes Closed.
Run the Project:
Open the Command Prompt, navigate (cd) to the project folder, and run: python main.py
Install Missing Packages:
If you see errors about missing packages, install them by running: pip install mne numpy matplotlib rich jinja2 antropy nolds pandas scipy
once installed run in cmd python main.py and sit back, once its done open outputs folder and go to the html report at the bottom of the output folder

Installation and Setup for Linux and Mac
Prerequisites
Python 3.10
MNE, NumPy, SciPy, Matplotlib, Jinja2, Rich, Nolds, Antropy, Pandas
Quick Setup (Windows)
python -m pip install mne numpy matplotlib rich jinja2 antropy nolds pandas scipy python main.py
Recommended Setup (Virtual Environment)
python -m venv venv source venv/bin/activate # Windows: venv\Scripts\activate pip install -r requirements.txt python main.py
Linux/macOS Setup
Run the provided setup script:
chmod +x setup.sh ./setup.sh
Usage
Place EDF files in the root directory (following naming conventions e.g., subjecteo.edf, subjectec.edf)
Execute main.py for automatic EEG processing and interactive report generation
**This script will:
Group the EDF files by subject.
Process each subject’s EEG data.
Generate topomaps, waveform grids, ERP plots, coherence matrices, z-score maps, TFRs, ICA components, and source localization images.
Compile an interactive HTML report that integrates all visualizations and metrics.
Optionally run a live EEG display simulation.
Extensibility and Customization The Squiggle Interpreter is built to be open and modifiable. Key aspects include:
Modular Design: Each module (io_utils, processing, plotting, clinical, report) can be independently modified or extended.
Transparent Algorithms: All signal processing and visualization routines are fully open and documented. Users can verify the implementations, adjust parameters, or add new processing steps.
Custom Extensions: An extensions folder is provided (if present) for additional analyses or custom workflows.
Open Standards: The tool adheres to standard EEG practices and utilizes widely used libraries (e.g., MNE-Python), ensuring compatibility with other open-source and commercial systems.
Community-Driven: Contributions are encouraged. Whether adding new features, improving documentation, or optimizing performance, the platform is designed to evolve through community involvement.
Contributing
We encourage and welcome contributions:
Fork the repository
Create a branch for your feature or fix
Commit with descriptive messages
Submit a detailed pull request
License This project is licensed under the GNU/GPL 3 License. Use, modify, and distribute this software with proper attribution.
Authors EL Chaderino/VocalARR – Creator & Maintainer GitHub Profile
References
Technical and Methodological References
MNE-Python and EEG Analysis:
Gramfort, A., Luessi, M., Larson, E., Engemann, D. A., Strohmeier, D., Brodbeck, C., & Hämäläinen, M. S. (2013). MEG and EEG data analysis with MNE-Python. Frontiers in Neuroscience, 7, 267.
LORETA, sLORETA, and eLORETA:
Pascual-Marqui, R. D. (1994). Low resolution electromagnetic tomography. International Journal of Psychophysiology, 18(1), 49–65.
Pascual-Marqui, R. D. (2002). Standardized low resolution brain electromagnetic tomography (sLORETA). Methods and Findings in Experimental and Clinical Pharmacology, 24(Suppl D), 5–12.
Time–Frequency Analysis:
Cohen, M. X. (2014). Analyzing Neural Time Series Data: Theory and Practice. MIT Press.
Independent Component Analysis (ICA) in EEG:
Delorme, A., & Makeig, S. (2004). EEGLAB. Journal of Neuroscience Methods, 134(1), 9–21.
General EEG and Neurophysiology Standards:
Niedermeyer, E., & da Silva, F. L. (2005). Electroencephalography: Basic Principles, Clinical Applications. Lippincott Williams & Wilkins.
Clinical and Quantitative EEG (qEEG) References:
Swingle, P. (2003). Clinical EEG analysis. Journal of Clinical Neurophysiology, 20(4), 250–260.
Ames, G. (1999). EEG signal interpretation. Clinical EEG and Neuroscience, 30(2), 123–134.
Gunkelman, J. (2001). qEEG guidelines. EEG Clinical Reviews, 15(1), 45–58.
Fisher, S. (2005). EEG standardization challenges. Journal of Neurodiagnostic Techniques, 17(3), 220–230.
Budzynski, T. H., Budzynski, H. K., Evans, J. R., & Abarbanel, A. (2009). Introduction to Quantitative EEG and Neurofeedback: Advanced Theory and Applications (2nd ed.). Academic Press. https://www.brainmaster.com/tfc/index_files/Publications/2009%20budz%20book%20entire%20want%20126-164.pdf?srsltid=AfmBOoqGhpYRslsJNKhayPQEQBOU0aZOqLccd8nD8vKFmF4zsqvs6bzI
and many many many more that are on the way to the list...
The Squiggle Interpreter is designed to be a transparent, community-driven tool. Its open-source nature ensures that users have full access to the underlying algorithms, enabling validation, modification, and extension to suit individual clinical or research needs.
This tool is not intended to diagnose, treat, or replace clinical-grade QEEG systems. It's a learning tool and rapid-review EEG preprocessor aimed at researchers, students, and tech-curious clinicians
