
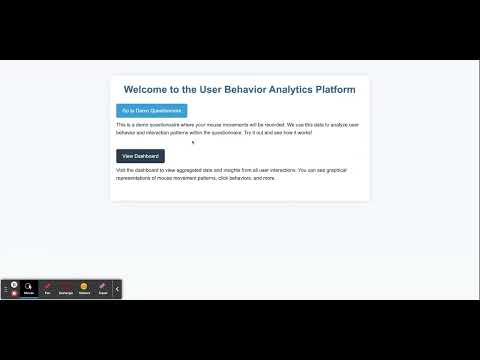
Mouse Logger is a passive data collection tool, aimed at recording mouse movements and interactions while users fill out a questionnaire. Built with JavaScript, this tool provides insights into user behavior, tracking parameters such as click frequency, movement speed, and direction. Post data collection, you can visualize this data graphically to derive meaningful insights.
- Passive Collection: Non-intrusive data collection without affecting user experience.
- Mouse Click Tracking: Monitor when and where users click within the questionnaire.
- Speed Tracking: Observe the speed of mouse movements throughout the session.
- Direction Tracking: Understand the direction of mouse movements.
- Graphical Visualization: Post-session visual breakdown of user mouse activity.
-
Clone the Repository
git clone https://github.com/morandanieli/mouse_logger.git
-
Navigate to the Project Directory
cd mouse_logger -
Start Services Using Docker Compose
docker-compose up
-
Embed the Logger
Embed the JavaScript logger script in your HTML questionnaire page:
<script src="/static/js/analyzer.js"></script>
-
Open your questionnaire page to begin collecting data!
After collecting data, navigate to the visualization dashboard (e.g., dashboard.html). Here, you can:
- View the heatmap of mouse clicks.
- Analyze mouse movement speeds.
We welcome contributions! If you find a bug or would like to add a new feature, feel free to open an issue or submit a pull request.
- Fork the repository.
- Create your feature branch (
git checkout -b feature/myNewFeature). - Commit your changes (
git commit -m 'Add some feature'). - Push to the branch (
git push origin feature/myNewFeature). - Open a pull request.
This project is licensed under the MIT License. See the LICENSE file for more information.
Made with ❤️ by Moran Danieli Cohen | © 2023 All rights reserved.