jtop is a free (GPL) ncurses-based java process viewer for Linux.
will share links for debian and centos shortly...
jtop must be run as the same user running the jvm localy, otherwise it will quit out with a warning message.
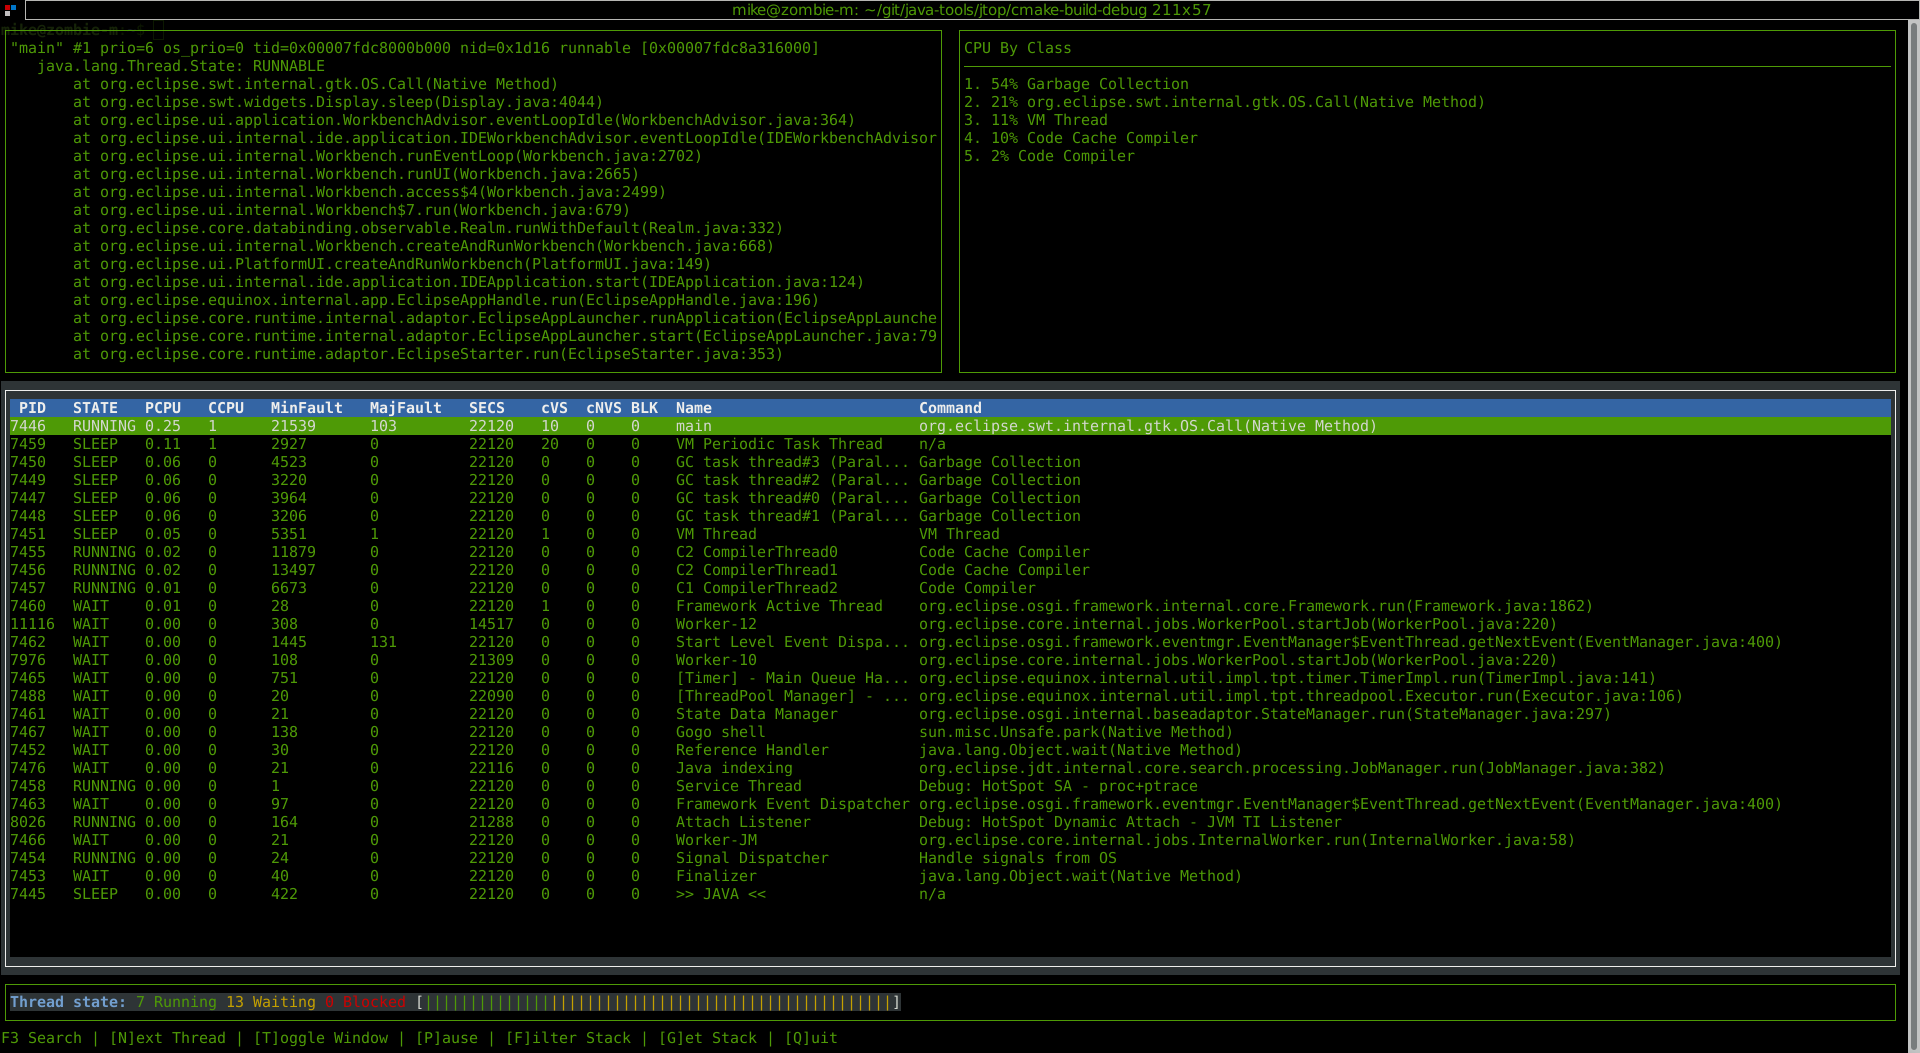
jtop
jtop by default will look for jvm instances to attach to and monitor. If multiple jvms are running, it will present a list to choose from.
jtop -p [PID]
using the -p arg, you can tell jtop which process id corresponds with the jvm you want to monitor.
| Name | Use |
|---|---|
| PID | OS Process ID of the java thread (tid) |
| STATE | The thread state, will be obtained from java but can be overridden by OS data on thread status |
| PCPU | This is the (percentage)CPU usage of the thread as you would see with tools like "top". |
| CCPU | This is the (calculated / sampled)CPU usage of the thread as you would see with tools like "htop". |
| MinFault | A minor page fault count for the thread. |
| MajFault | A major page fault count for the thread. |
| SECS | Number of seconds the thread has been running. |
| SEGV | Unused - more info below... -- REMOVED |
| cVS | Calculated / Sampled rate of Volantary Context Switches |
| cNVS | Calculated / Sampled rate of NON-Volantary Context Switches |
| BLK | A count of how many threads are blocked by the current thread. |
| Name | The thread name, for example "main" or "VM Thread". |
| Command | The current java command the thread is working on. |
whilst jtop is running you can use the following function keys:
| Key | Function |
|---|---|
| t | Toggle Window Focus |
| Scroll up in the stack window or navigate up 1 thread in thread window. | |
| Scroll down in the stack window or navigate down 1 thread in thread window. | |
| n | navigate to the next thread in stack window. |
| shift+n | navigate to the previous thread in stack window. |
| p | Pause / un-pause all polling of stats, this will prevent threads from jumping up and down the list is ordered by cpu usage. |
| f | Toggle filtered mode, see filterd mode for more info. |
| g | Get up to date info on current commands and class from the jvm to refresh jtop. (OS stats are automatically polled). |
filter mode allows you to exclude certain class from the command list and the stack view, this allows you to focus on project specific code. You could also see many threads are on a single class, but striping back non project code allows you to identify the calling code.
excludes for filter mode are imported from the file: $HOME/.jtop-exclude
sample config:
$ cat .jtop-exclude
java.lang
java.util
sun.misc
sun.reflect
org.eclipse.core.internal.jobs.WorkerPool.sleep
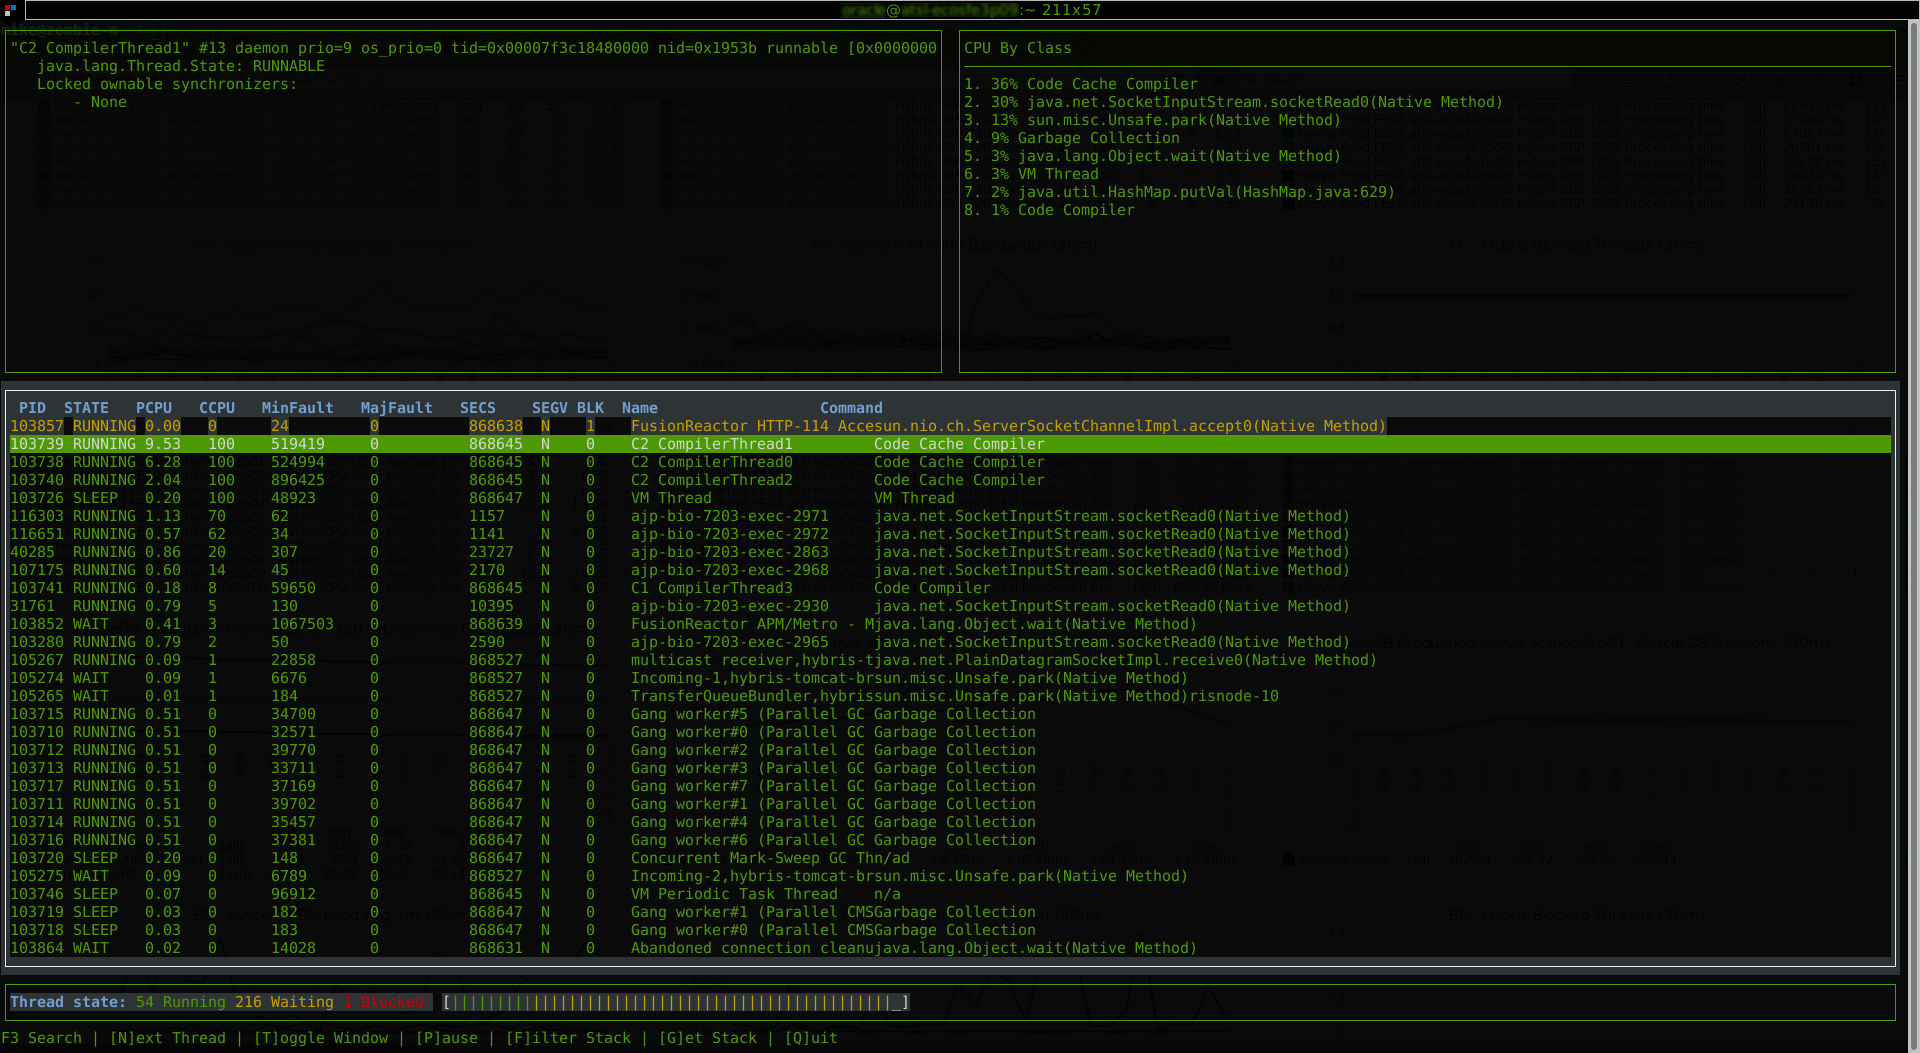
High CPU:
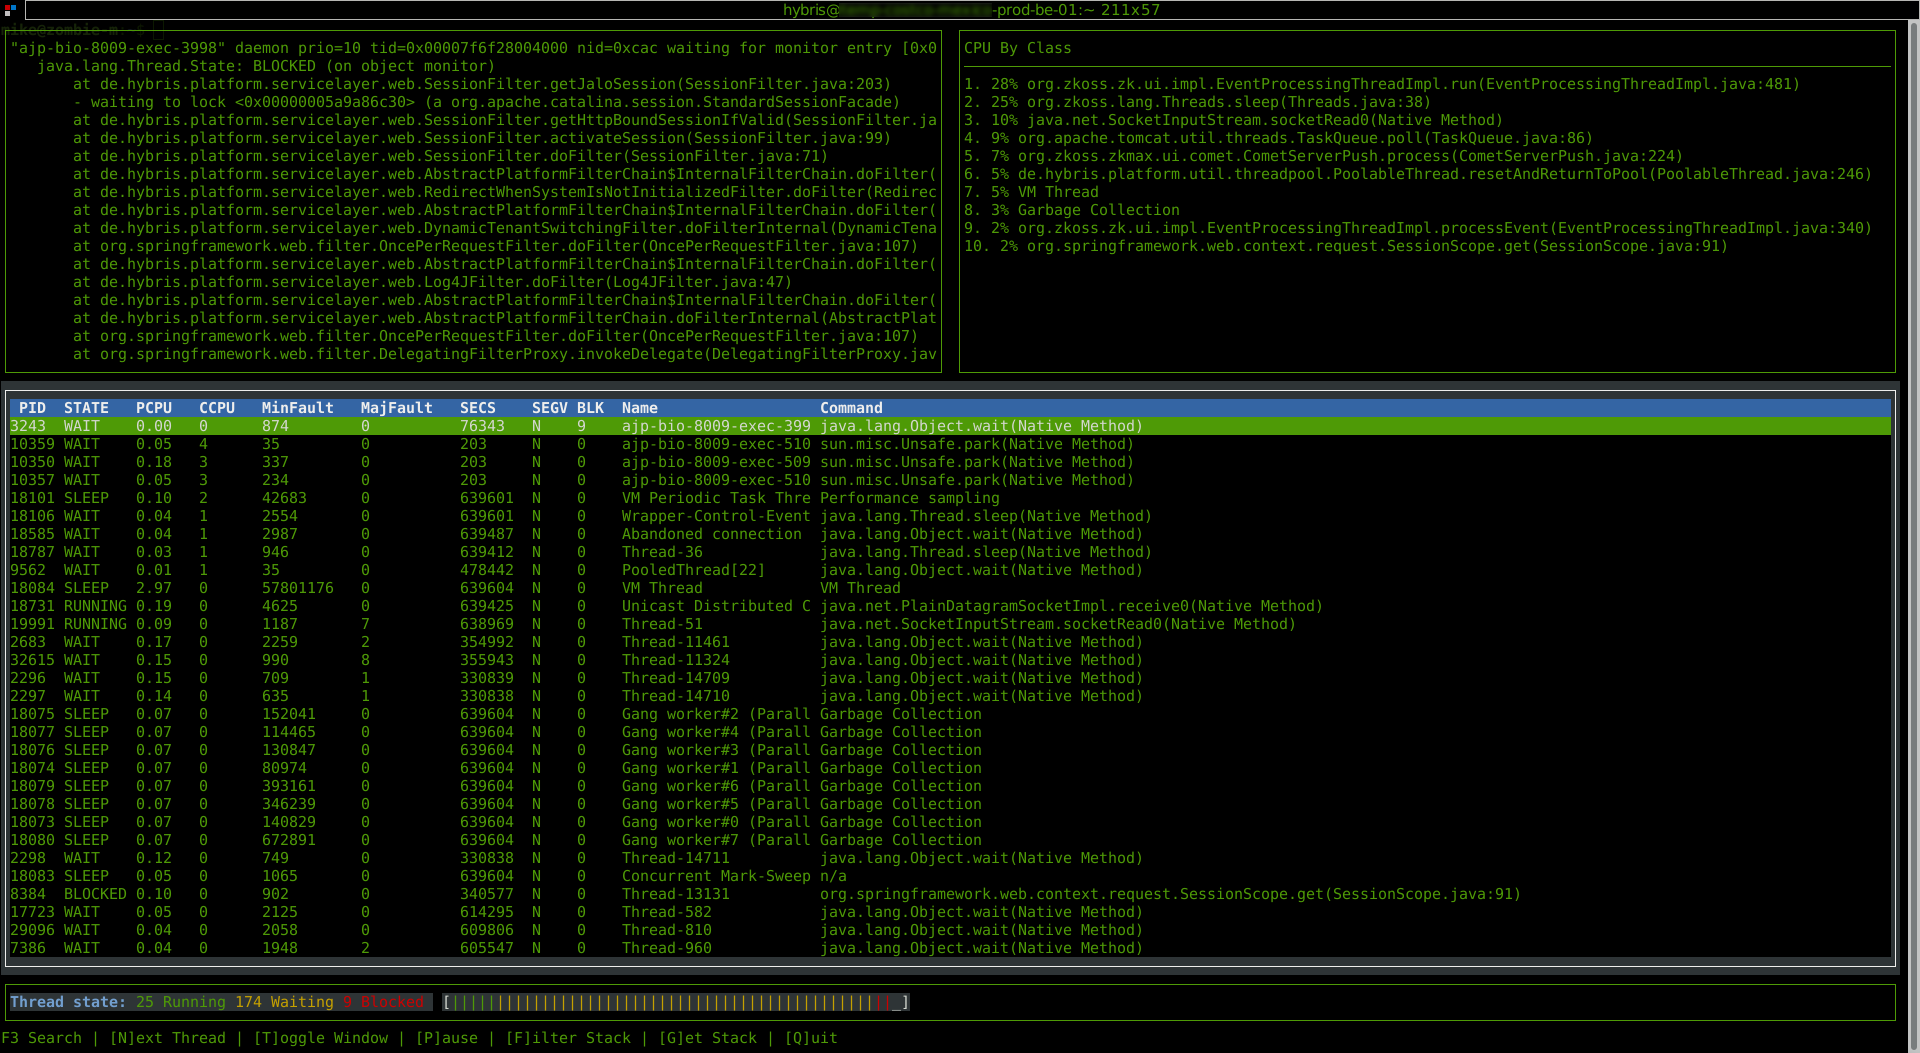
 Blocked Threads Inspection (p1):
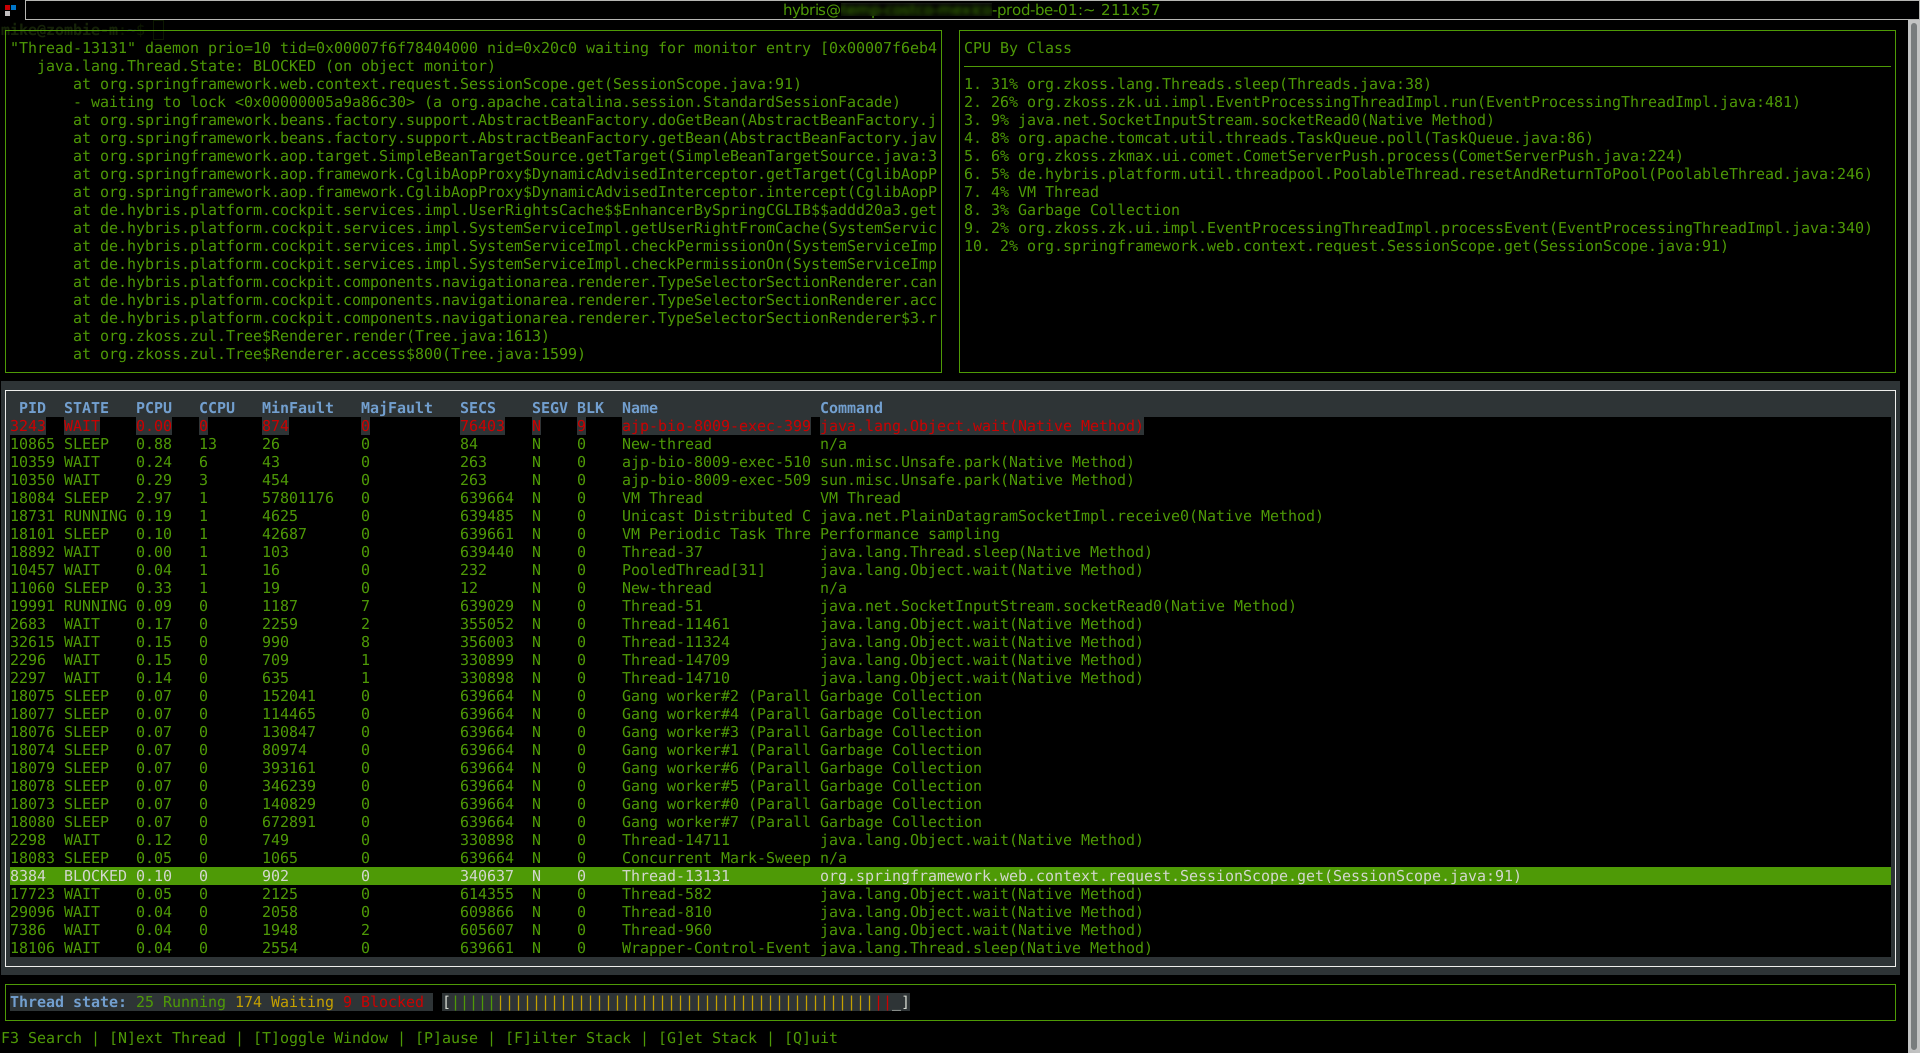
 Blocked Threads Inspection (p2):
 Issues with Code Cache