Insights into work patterns of superuser and the resulting impact
Additional Resources: Viva Insights Python Library Viva Insights R Library
▶️ Super User Impact Dashboard Preview
- NEW 'Super User Impact' dashboard that explores the impact of Copilot on work patterns (& sentiment if available) and estimated value
- Static thresholds for usage tiers (clearer benchmarking)
- One click zoom into superusers
- Cross-team comparisons
Super usage patterns show how experimentation turns into durable habits. Identifying early signals and contextual attributes helps you:
- Replicate adoption paths
- Prioritize enablement
- Benchmark across teams
- Inspire the organization
Super Usage Profile What defines super usage, which Copilot scenarios super users rely on, and whether their behavior shows early signs of workflow change.
Work Impact How users progress into super users, is this population growing over time?
Work Patterns The distinctive work patterns of super users—including meeting habits, collaboration behaviors, and after‑hours signals.
How They Get Work Done How super users leverage Copilot across surfaces and features to drive productivity in their daily workflows.
Value How assisted value differs between super users and everyone else, and what this reveals about the incremental impact of deep Copilot engagement.
This repository includes two Power BI templates:
Super User Impact Templates
- Template - Super User Impact - (CSV Input).pbit: Measures Copilot's impact on work patterns and productivity using CSV data. Includes estimated value and sentiment analysis.
- Template - Super User Impact - (Viva Insights Input).pbit: Same analytics with direct Viva Insights connection for continuous impact tracking.
Choosing Your Setup:
Use CSV templates for ad-hoc analysis, simpler setup, or easier sharing. Use Viva Insights templates for automatic refresh, real-time data, and ongoing executive dashboards.
For Python Users: If you prefer programmatic analysis or need custom workflows beyond these Power BI templates, check out the Viva Insights Python Library for direct API access, advanced data manipulation, and integration with your Python data science stack.
For R Users: Explore the Viva Insights R Library for statistical analysis, custom visualizations, and seamless integration with R-based data science workflows.
Sample Code & Examples: Browse the Viva Insights Sample Code Repository for ready-to-use code examples, API integration patterns, and reference implementations across multiple programming languages.
These tools enable you to build custom super usage analyses, automate reporting pipelines, and extend the insights beyond what's available in the Power BI templates.
⚠️ Disclaimer
This is an experimental template. On occasion, you may notice small deviations from metrics in the Copilot Dashboard. We will continue to iterate based on your feedback. Currently available in English only.
-
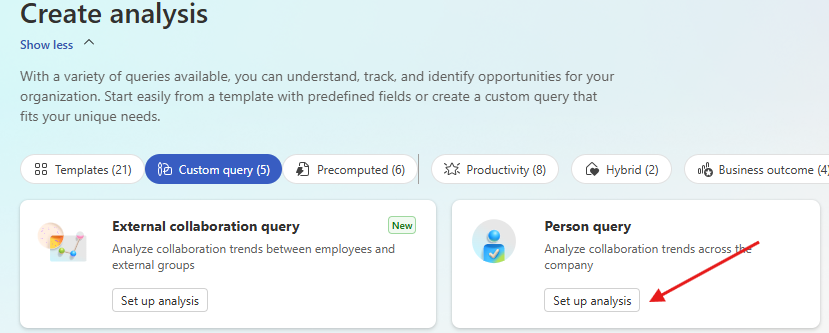
Open: https://analysis.insights.cloud.microsoft/ and go to Create Analysis.
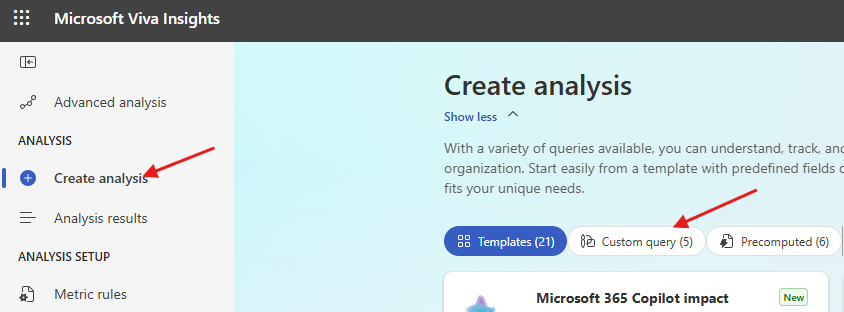
-
Select Person Query → Set up analysis.
-
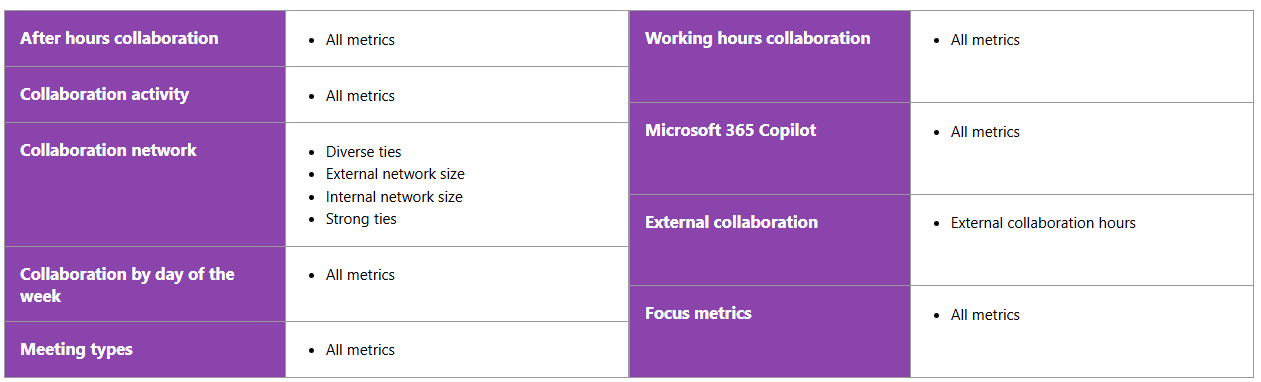
Configure:
- Time period: Last 6 months (rolling)
- Group by: Week
- Metrics: See sub-step 4 for required attribute selection.
- Filter: Is Active = True (if available) - You can validate the number of employees here.
- Attributes: Include Organization and Function Type (others optional) - this is the last box on this page.
-
Select ALL required metrics (missing one will cause blank visuals).
-
Save & Run query. Wait until Status = Completed (first runs can take several hours). Do not export mid-processing.
Import a CSV File
- Export results as CSV → Save clearly (e.g.,
SuperUsagePersonQuery_YYYY-MM-DD.csv). - Open
Template Super Usage Analysis (CSV).pbit→ point to CSV file path. - Save working PBIX and publish to Power BI service for sharing (manual refresh required for updates).
Setup Direct Query to Viva Insights
- From Person Queries page, copy link (row/link icon).
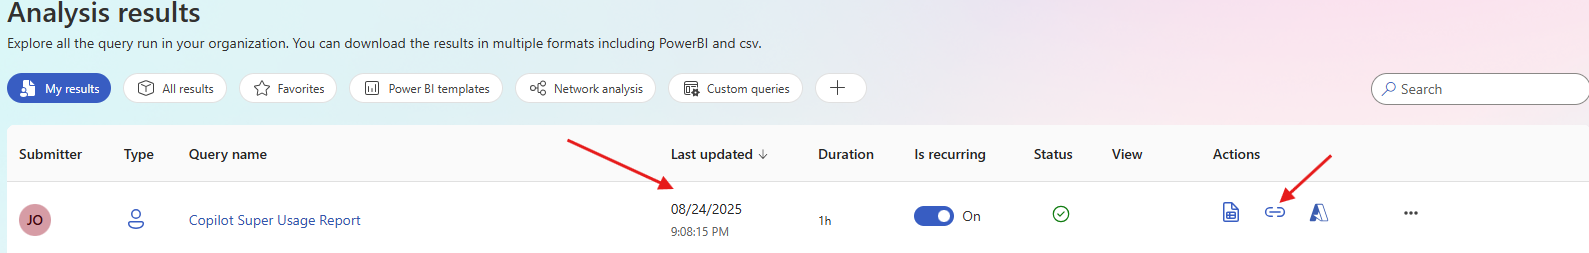
- Extract partitionId and queryId from URL. Confirm 36 characters each.
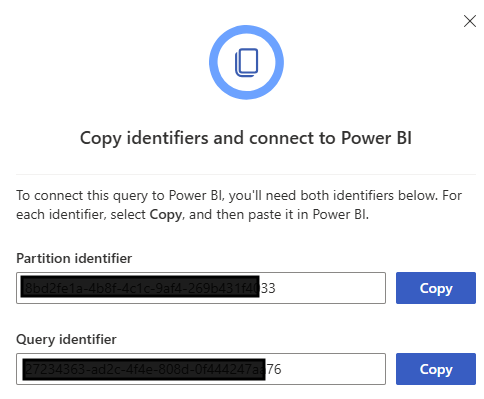
- Open
Template Super Usage Analysis (Direct Query).pbit→ paste IDs when prompted. - Sign in with your work account. Initial load may take 1–3 minutes.
- Save PBIX and publish to Power BI workspace. No scheduled refresh required (Direct Query auto-refreshes weekly).
Validation & Troubleshooting
Checklist for success:
- No errors on load
- Fields pane includes expected tables
- Executive Summary visuals populate (not all blank)
Common Mistakes & Fixes
| Symptom | Cause | Fix |
|---|---|---|
| Blank visuals | Missing required metric(s) | Re-export/re-run query with full set |
| Missing slicers/labels | Skipped Org/Function Type | Add both attributes and reprocess |
| Trend calcs broken | Grouped by Month | Use Week grouping |
| Partial weeks | Exported mid-processing | Wait until Status = Completed |
| Distorted adoption rates | Didn't filter active users | Add Is Active = True |
| Load error | CSV open in Excel (Option 1) | Close file and retry |
| Direct Query blank | Wrong GUIDs or status not complete | Re-check IDs and query status |
Publish / Distribute
- Save your PBIX file after setup.
- If using Direct Query, publish to a Power BI workspace and configure credentials (OAuth2).
- If using CSV Import, publish the PBIX file but note that refreshes are manual.
Interpretation & Storytelling
Leverage the guides below to frame your narrative and drive action:
- Copilot Assisted Hours PBI Formulas Guide (PDF)
- Copilot Studio Agents Report - Interpretation Guide (PDF)
- Superuser Impact Storyboard v4 (PowerPoint)
Use the included guides to:
- Create an executive-ready presentation
- Define what constitutes super usage internally
- Highlight early activation behaviors
- Recommend enablement actions per org or cohort
Monitor with Automatic Refresh
- Configure Published Report Refresh settings
- Navigate to Power BI Web (you may need to login)
- Find the Report and Semantic Model you just published.
- Hover over the Semantic Model and click on the icon as seen below:

- On this page, from the list of options available, click on Refresh and then configure your report as seen below in the screenshot, or as you best fits your needs.
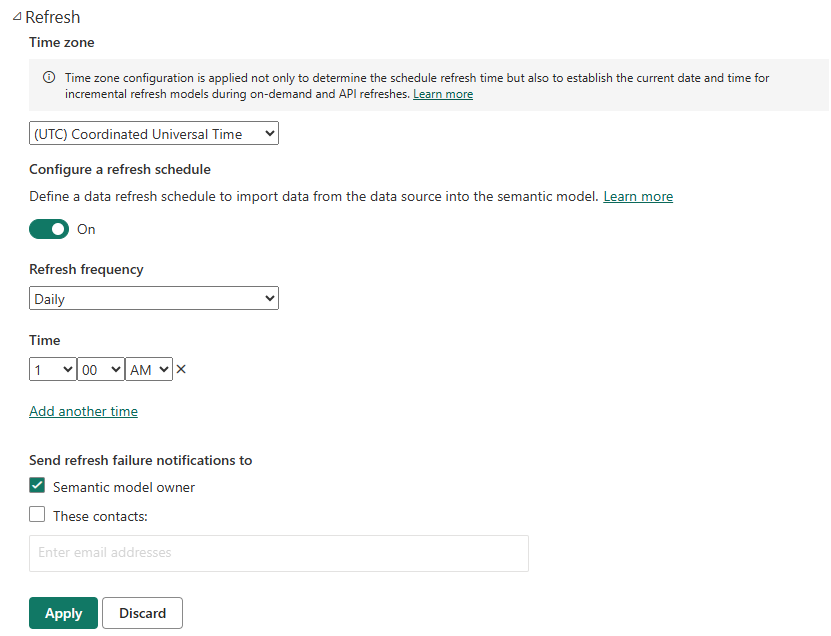
- For Direct Query: Reports update automatically with each weekly Viva Insights refresh, but you will still need to update the published report refresh settings as seen above.
- For CSV Import: Re-run your query, export a new CSV, and repoint the PBIX to the updated file.
- Verify weekly that a new week of data appears.
- Track emerging super users and adoption trends regularly.
We want to hear your feedback and suggestions. Please reach out to keithmcgrane@microsoft.com.
|
✨ This report wouldn't have been possible without the magic of GitHub Copilot.
As a tribute, we have built this GitHub Copilot analytics report. @microsoft/GitHubCopilotImpact — try it out and give us feedback! |
🤔 Curious how free chat, M365 Copilot, and agent usage all connect?
Check out the companion report at @microsoft/AI-in-One-Dashboard |