![]()

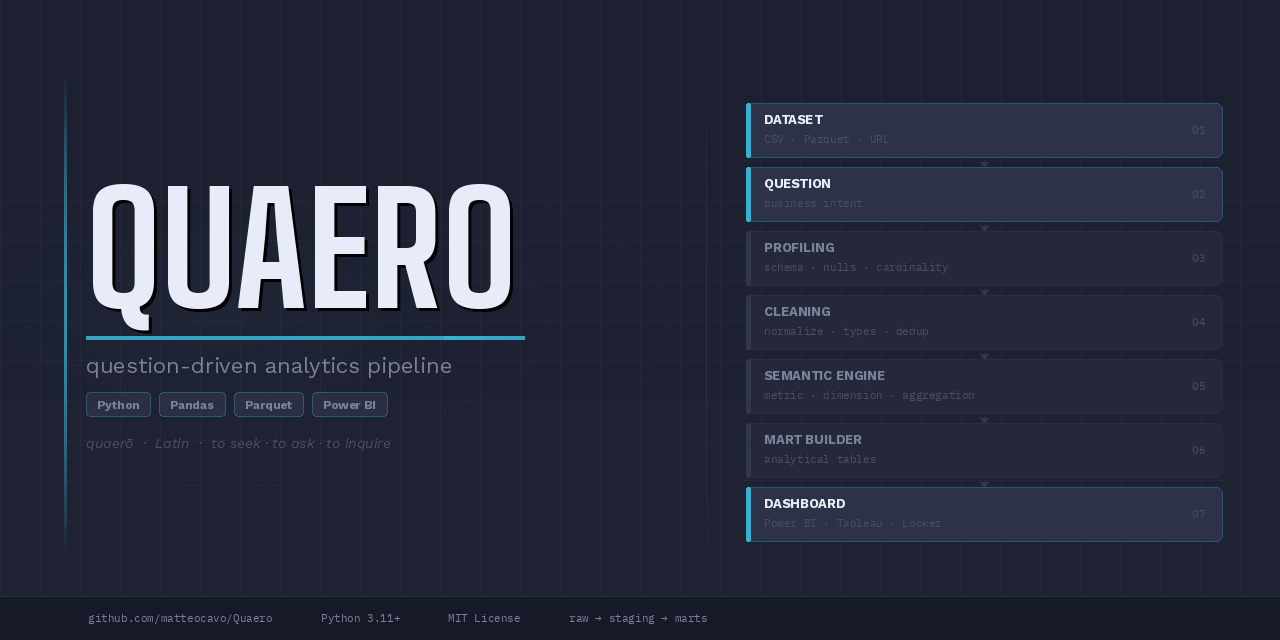
Quaero is a question-driven analytics pipeline that converts raw datasets into clean analytical marts, semantic metrics, and dashboard-ready outputs.
Data analysts often spend more time preparing data than analyzing it.
Real-world datasets frequently arrive as messy exports with inconsistent schemas, missing documentation, and manual cleaning steps.
Quaero provides a lightweight analytics pipeline that converts raw datasets into structured analytical marts and semantic metrics ready for BI tools.
Dataset → Question → Analytical Marts → Dashboard
                +------------------+
Dataset ───────▶| Ingestion        |
                +------------------+
                         │
                         ▼
                +------------------+
                |  Profiling       |
                +------------------+
                         │
                         ▼
                +------------------+
                | Cleaning         |
                +------------------+
                         │
                         ▼
                +------------------+
Question ──────▶| Semantic Engine  |
                +------------------+
                         │
                         ▼
                +------------------+
                | Mart Builder     |
                +------------------+
                         │
                         ▼
                +------------------+
                | Dashboard Engine |
                +------------------+
                         │
                         ▼
                Dashboard-ready outputs
Steps performed automatically:
- dataset profiling
- data cleaning and normalization
- semantic inference of metrics and dimensions
- optional LLM-assisted inference fallback for ambiguous questions
- mart table generation
- analytics metadata creation
- anomaly detection
- dashboard suggestions
- dashboard-ready analytical marts
Pipeline outputs are isolated per project so runs from different datasets do not
mix snapshots, marts, or metadata in shared folders. If an artifact depends on
a dataset, mart, metric column, business question, or pipeline run, it is
stored under projects/<normalized_source_name>/.
Canonical structure:
projects/
  <project_name>/
    raw/
    staging/
    integrated/  # optional, only for projects that combine multiple datasets
    marts/
    metadata/
    README.md
Project-specific files include raw snapshots, staging outputs, optional integrated datasets, mart tables, profiling output, run manifests, anomaly reports, analytics metadata, dashboard suggestions, semantic metadata, generated project documentation, and final_summary_report.json.
Within each project, marts/ stores analytical tables used by the pipeline and can be loaded directly into BI tools such as Power BI, Tableau, and Looker Studio. Each generated project README.md also includes automatic profiling-driven sections for dataset overview, dataset description, metric interpretation, analysis results, generated artifacts, and project-specific coverage information. Project README titles are automatically humanized from the project identifier, for example global_economic_indicators becomes Global Economic Indicators Analysis.
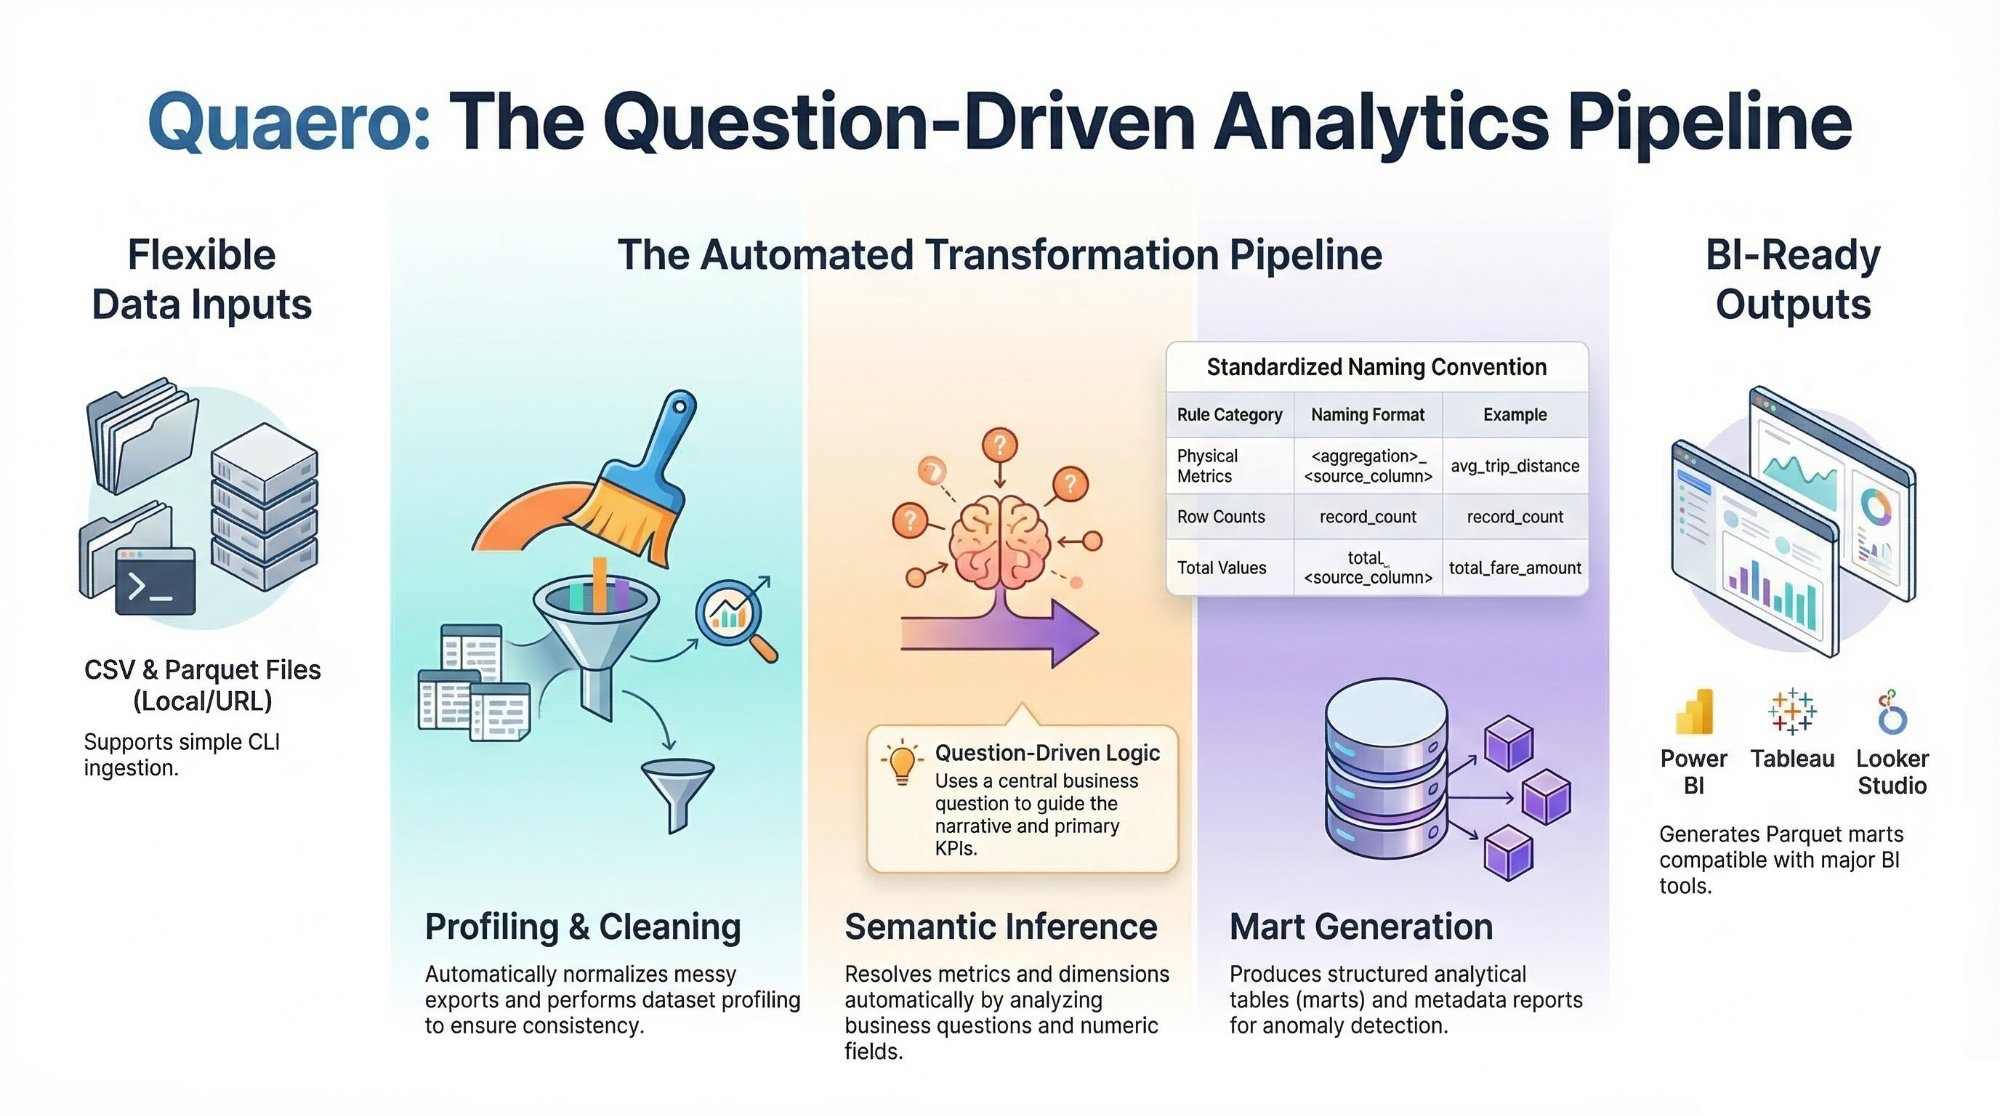
Quaero applies a framework-wide semantic naming rule to generated metric columns so outputs remain self-descriptive across datasets.
Rules:
- avoid generic metric names such as
metric_value,value, ormeasure - use
<aggregation>_<source_metric_column>when a physical source metric exists, for exampleavg_trip_distance,total_fare_amount, oravg_streams - use
record_countfor row-count metrics This rule applies across analytical marts and summary outputs.
Repository note:
- the repository root folder should also use the project name
Quaerowhen possible
- Create a Python 3.11+ virtual environment.
- Install dependencies:
pip install -r requirements.txt
pip install pytest ruffThe CLI in app/main.py supports:
- local CSV files
- local Parquet files
- direct CSV URLs
- direct Parquet URLs
The current outputs are BI-tool agnostic in positioning and can feed multiple dashboard tools, including Power BI, Tableau, and Looker Studio, by loading the generated marts directly.
Quaero can now be used in three ways:
- from the CLI for direct and config-driven runs
- as an importable Python module for app integrations
- through the local Streamlit UI in
app/ui.py
The module-friendly helpers exposed by app/main.py are:
from app.main import run_pipeline, run_project_pipeline

result = run_pipeline(
    dataset_path="sample_data/release_impact_sample.csv",
    source_name="release_impact",
    question="Which release years generate the strongest average streams?",
    project_root=".",
)

project_result = run_project_pipeline(
    config_path="projects/global_economic_indicators/project_config.json",
    project_root=".",
)
These helpers return the full pipeline result dictionary, which makes them suitable for Streamlit or other lightweight application layers.
The preferred workflow is now question-driven. In the common case, you only need:
- a dataset input
- a business question
- a source name
- a project root
Use the CLI to run the pipeline on a local file or direct URL:
python -m app.main sample_data/release_impact_sample.csv \
  --source-name "release_impact" \
  --question "Which release years generate the strongest average streams?" \
  --project-root .
PowerShell example on one line:
python -m app.main sample_data/release_impact_sample.csv --source-name "release_impact" --question "Which release years generate the strongest average streams?" --project-root .--metric-column and --dimension-column are now optional overrides. The pipeline uses
deterministic semantic inference to resolve:
- the metric column from numeric fields and metric-related question terms
- the dimension column from grouping-friendly categorical, temporal, or strongly hinted ID/location fields
- the aggregation intent from keywords such as
average,total,count,highest, orlowest
Use --metric-column or --dimension-column only as manual overrides when the
question is too ambiguous for automatic inference.
When deterministic inference cannot confidently resolve a metric or dimension,
Quaero can optionally use an LLM fallback. This path is disabled by default and
is only activated when QUAERO_ANTHROPIC_API_KEY is present in the environment.
If the fallback succeeds, the selection mode is recorded as llm_assisted;
otherwise Quaero keeps the existing deterministic error behavior and asks for a
manual override.
Manual override example:
python -m app.main sample_data/release_impact_sample.csv \
  --source-name "release_impact" \
  --question "Which release years generate the strongest average streams?" \
  --metric-column streams \
  --dimension-column release_year \
  --project-root .
Local Parquet example:
python -m app.main projects/nyc_taxi/raw/yellow_tripdata_2024-01.parquet \
  --source-name nyc_taxi \
  --question "Which pickup locations generate the highest average trip distance?" \
  --project-root .
Direct URL CSV example:
python -m app.main "https://datahub.io/core/s-and-p-500-companies/r/0.csv" \
  --source-name sp500 \
  --question "Which sectors contain the highest number of companies?" \
  --project-root .
Direct URL Parquet example:
python -m app.main "https://example.com/data/yellow_tripdata_2024-01.parquet" \
  --source-name nyc_taxi \
  --question "Which pickup locations generate the highest average trip distance?" \
  --project-root .
The CLI automatically normalizes the source name and creates the project folder
at projects/<normalized_source_name>/ before running any pipeline modules.
The framework also supports config-driven project execution for one-dataset and multi-dataset projects:
python -m app.main --config projects/<project_name>/project_config.json --project-root .Config mode still remains question-driven. Each project-level project_config.json must
include a top-level question, and that question is propagated into:
projects/<project_name>/metadata/final_summary_report.json- the generated project
README.md projects/<project_name>/metadata/dashboard_suggestions_<project>.json
The project question guides the primary analytical narrative by influencing:
- the selected primary mart in the summary and README
- the explanation text in the generated README
- the lead metric and primary mart recorded in dashboard suggestions
Generic marts are still preserved. The question affects emphasis and narrative, not whether the framework generates its standard outputs.
Example config:
{
  "project": "global_economic_indicators",
  "question": "How do global GDP, inflation, and unemployment evolve over time and how are they related?",
  "datasets": [
    {
      "name": "gdp",
      "url": "https://raw.githubusercontent.com/datasets/gdp/master/data/gdp.csv",
      "time_column": "year"
    },
    {
      "name": "inflation",
      "url": "https://api.worldbank.org/v2/country/all/indicator/FP.CPI.TOTL.ZG?format=json&per_page=20000",
      "time_column": "year"
    }
  ]
}
For the public repository, global_economic_indicators is the single
maintained config-driven demo project kept alongside the framework. Additional
real-world projects are intended to live in separate repositories and link back
to Quaero as the underlying engine.
After a successful run, the pipeline produces outputs such as:
- raw snapshot under
projects/release_impact/raw/ - cleaned staging data under
projects/release_impact/staging/ - analytical marts under
projects/release_impact/marts/ - metadata outputs under
projects/release_impact/metadata/ - final summary report at
projects/release_impact/metadata/final_summary_report.json
The marts/ directory stores the analytical tables used for answering the question and supporting diagnostics. These marts are dashboard-ready and can be loaded directly into Power BI, Tableau, Looker Studio, and other BI tools that support Parquet files.
Common metadata files for the demo include:
projects/release_impact/metadata/release_impact_profile.jsonprojects/release_impact/metadata/cleaning_summary_release_impact.jsonprojects/release_impact/metadata/analytics_metadata_release_impact.jsonprojects/release_impact/metadata/dashboard_suggestions_release_impact.jsonprojects/release_impact/metadata/anomaly_report_release_impact.jsonprojects/release_impact/metadata/metrics_definitions.json
For config-driven projects, final_summary_report.json also records:
- the project question
- the selected primary mart and primary KPI
- per-dataset coverage with
min_yearandmax_year
This coverage metadata helps BI authors understand why an integrated dataset may contain later years for some metrics and nulls for others without inspecting raw Parquet files directly.
A small runnable sample dataset is included at:
sample_data/release_impact_sample.csv
sample_data/ should contain only tiny demo files or lightweight
documentation. Large real datasets should not be committed to the repository.
Use large local or downloaded datasets by pointing the CLI at a local path or a direct file URL without committing the data to GitHub.
Recommended guidance:
- keep large real datasets outside the repository when possible
- use
sample_data/only for tiny demo assets or documentation - store download links and local setup instructions in docs instead of checking the data into git
- run larger datasets from a local path or project-specific raw folder such as
projects/<project_name>/raw/
This keeps the repository lightweight while still making it easy to test the pipeline with realistic external data.
Quaero includes a lightweight local UI at app/ui.py.
Run it with:
streamlit run app/ui.pyThe UI is a thin layer over the same module helpers used by the CLI. It now supports:
- single-dataset runs from an uploaded CSV/Parquet file
- single-dataset runs from a direct dataset URL
- multi-dataset project runs built in the UI with one source per dataset
- uploaded files or fetch URLs for each dataset in a config-driven project
For multi-dataset runs, the UI writes a stable project_config.json under the
project folder and reuses the standard config-driven pipeline path, so the UI is
now aligned with Quaero's actual multi-dataset architecture instead of exposing
only the single-dataset path.
Run the automated tests with:
pytest tests