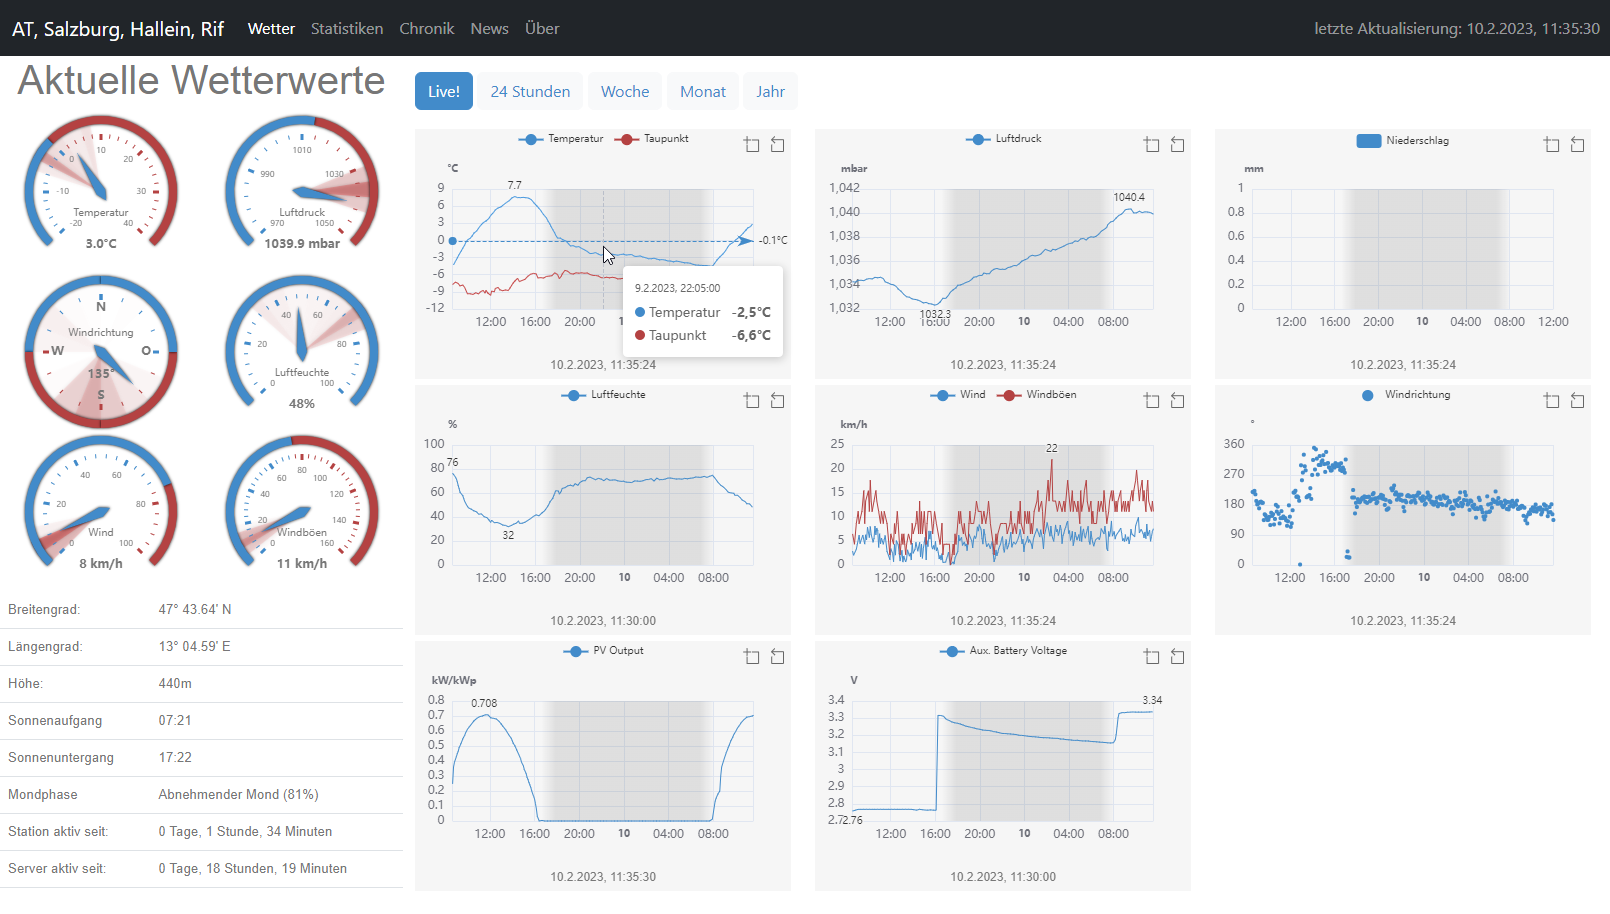
Gauge graphics showing current conditions.
Interactive charts showing conditions over a timespan
MQTT enabled Gauges and charts - live weather data! (Live data needs extra extensions and configurations for publishing and subscribing MQTT messages and topics) see: https://github.com/brewster76/fuzzy-archer/wiki/MQTT-setup
Statistics: daily/weewly/monthly/yearly/alltime, highs/lows, ...
Historic data in color coded html tables.
Available in multiple languages. Help wanted! We need help with translations for:
- traditional chinese
- czech
- spanish
- finnish (there isn't even a language file stub yet)
- french
- greek
- italian
- korean (there isn't even a language file stub yet)
- dutch
- thai
Read the upgrading guide, if you already have an older version installed: https://github.com/brewster76/fuzzy-archer/wiki/Upgrading-to-v4
New in v4.0:
- Complete and thorough overhaul of the skin, many breaking changes. It is recommended to start over with a fresh install
- This skin used to consist of three skins, now reduced to one
- Localization is now done the WeeWX way
- Less and easier configuration
- Many customizations can now be done by configuration only, no more need to touch the templates
- Day/night background in Live Charts (needs pyephem installed)
- Bug fixes and other enhancements
See it in action with live data (~30s. refresh interval):
See it in action (legacy v2.x): dajda.net
Gauge with 3 Needles / Markers examples:


Frequently asked questions: here