software to visualize graph coloring algorithm
This project is an implementation of an online algorithm called MINADM[1]. The algorithm colors the network following a few steps.
- NetworkX
- Tkinter
- PIL
$ pip install Networkx
$ pip install Tkinter
$ pip install Pillow
- python 3.10
It is recommended to use Pycharm, you'll have to install the packages, but it is far more convenient.
This work was done with Anya H. during our degree under the supervision of Prof. Shmuel Zaks.
Welcome page
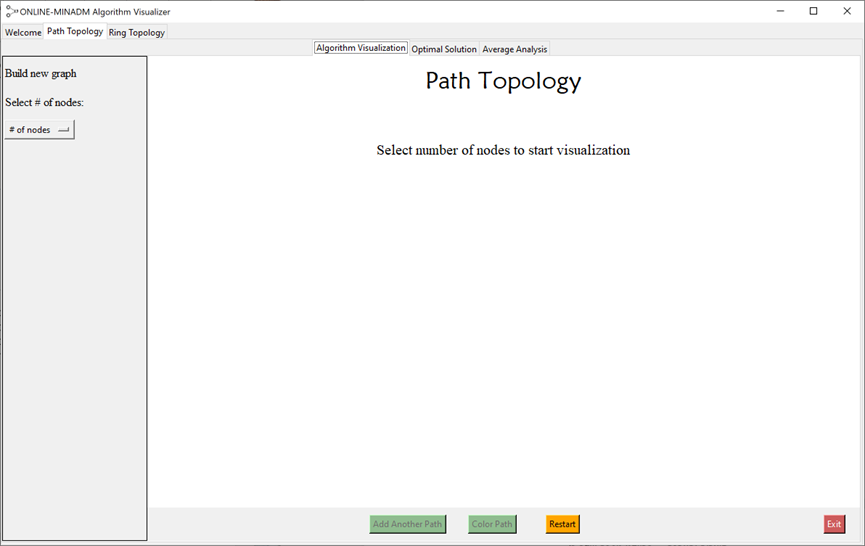
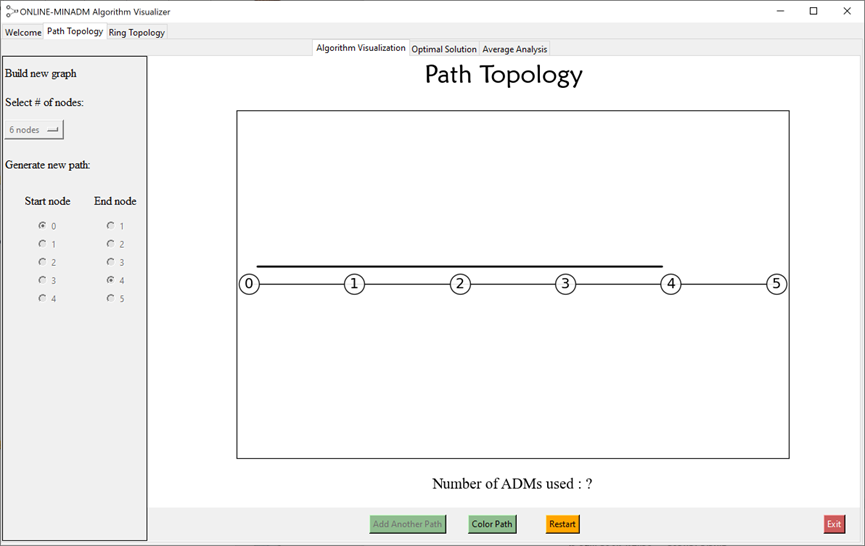
You can choose any topology you want- path or ring topology. After choosing you can build your own network, you can choose any size of network you want and any possible path and see the process of the coloring.

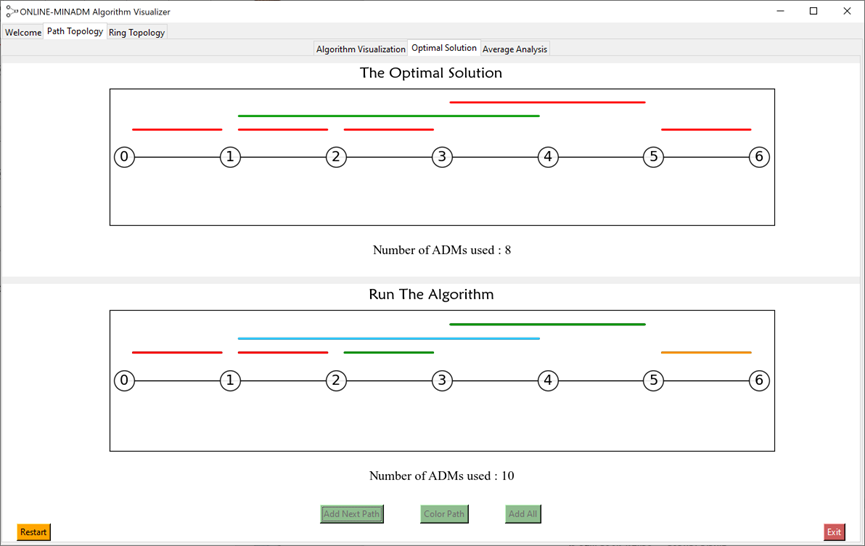
Another functionality is that you can compare some network over the optimal solution and see where the online algorithm MINADM colors the paths differently. Also, you can see the number of ADMs used using the optimal solution and the solution of the algorithm.
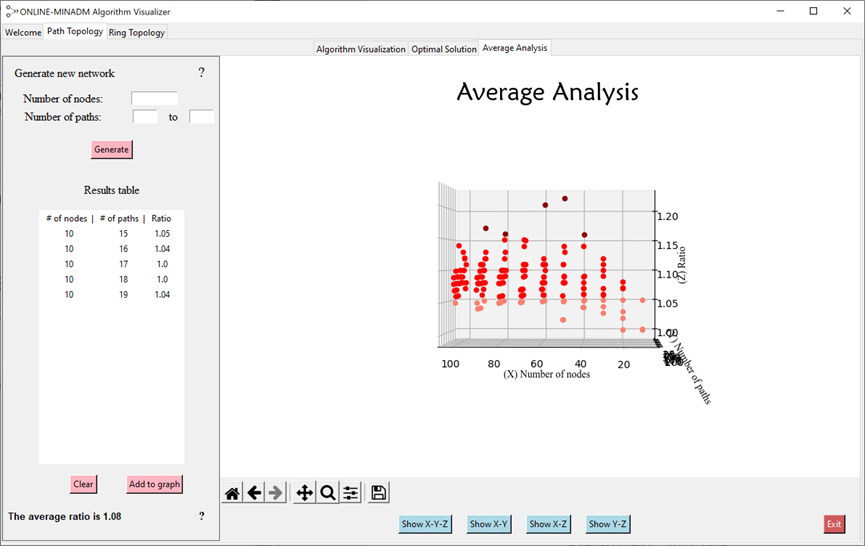
The last functionallity of the software is the ratio analysis. In the thirs tab you can do two things, either to calculate the analysis on the network the user inputs or see the 3D graph where you can see the average ratio we got after running the algorithm over different sized networks and paths.
[1] = Shalom, M., Wong, P. W., & Zaks, S. (2007, September). Optimal on-line colorings for minimizing the number of ADMs in optical networks. In International Symposium on Distributed Computing (pp. 435-449). Springer, Berlin, Heidelberg.