Author: Yinhui(Kami) Yang
OBJECTIVE: Flight delays on airlines are common and have a big impact on both travelers and carriers. The study’s goal is to identify the average gain situation for flights.
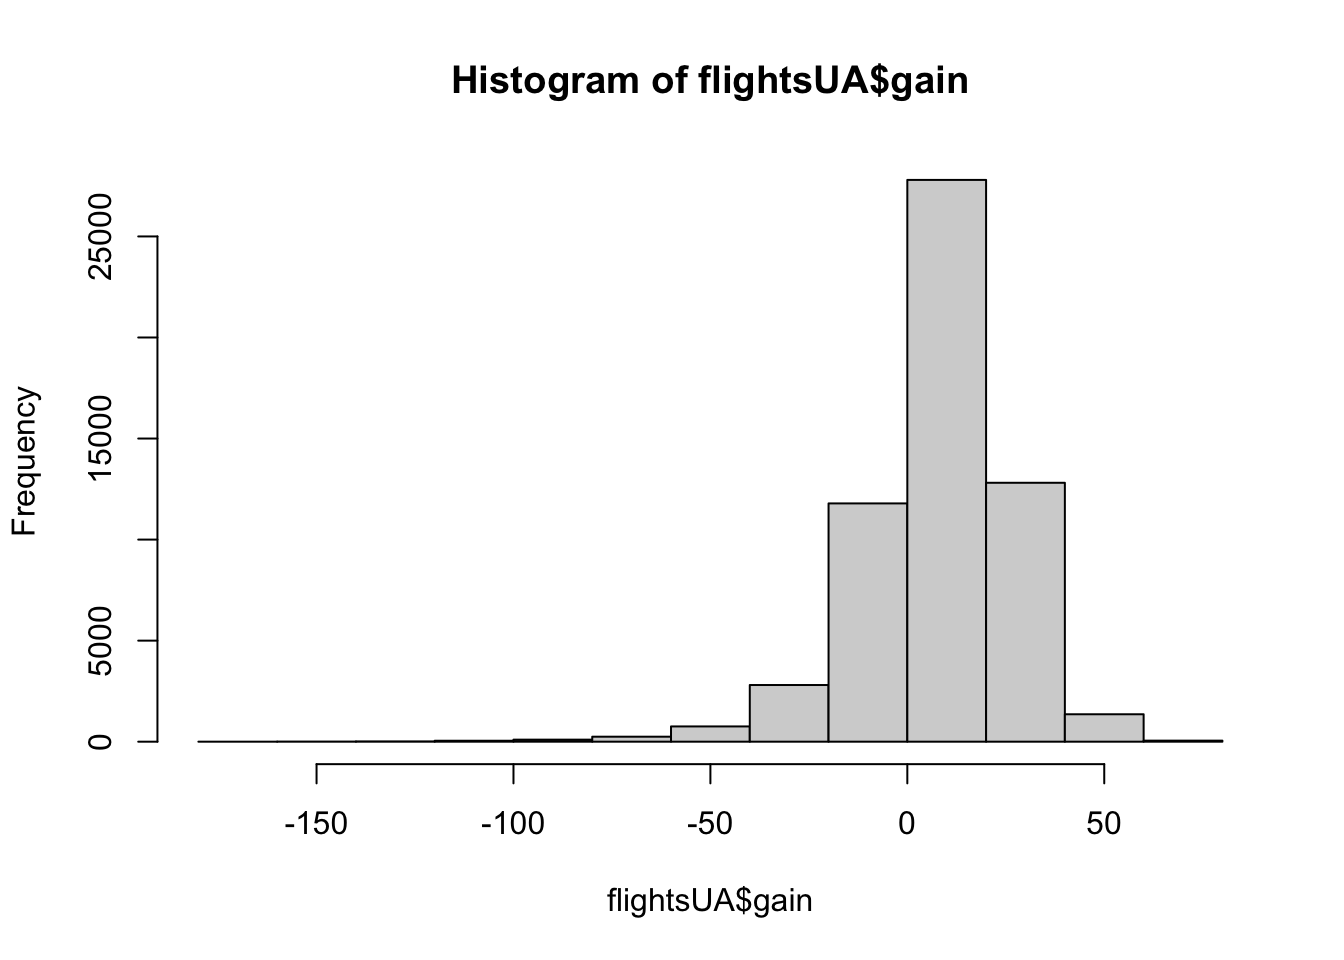
METHODS: We first use the departure delay divided by arrival delay to solve the gain, and then we use the average air time in minutes to solve the difference in flight duration between the long and short routes. Also, appropriate some exploratory analysis if needed, since we believe that could help in finding with substantial delays’ causes and average gain.
RESULTS: The permutation tests with difference model results was just 0.002 which we conclude that there is a statistically significant difference in average gain and relative gain. Diagnostic histogram charts that indicate top 5 most common destination airports reveals a commonality in having similarly modal peak at a gain, and when we look at the average of top 5 most common destination airports average gain are between 5 to 10, so that we have strengthens reason to believe significant difference for each case.
CONCLUSION: Airlines report the reasons for delays in different major categories, but in-deep, flight delay, flight departure, flight arrival, and flight duration problems are the main causes of delays. In conclusion, the dataset lacked the predictors necessary to fully account for air traffic congestion, delayed arrivals, boarding issues, personnel problems, and mechanical issues. This constitutes a study restriction. But we still could conclude that the flight delays and flight planning we have experienced thus far are serious problems. Therefore, in order to increase productivity and customer satisfaction, we would need to prioritize reducing flight delays, lengthening flights, and working on flight planning.

1. Does the average gain differ for flights that departed late versus those that did not? What about for flights that departed more than 30 minutes late?
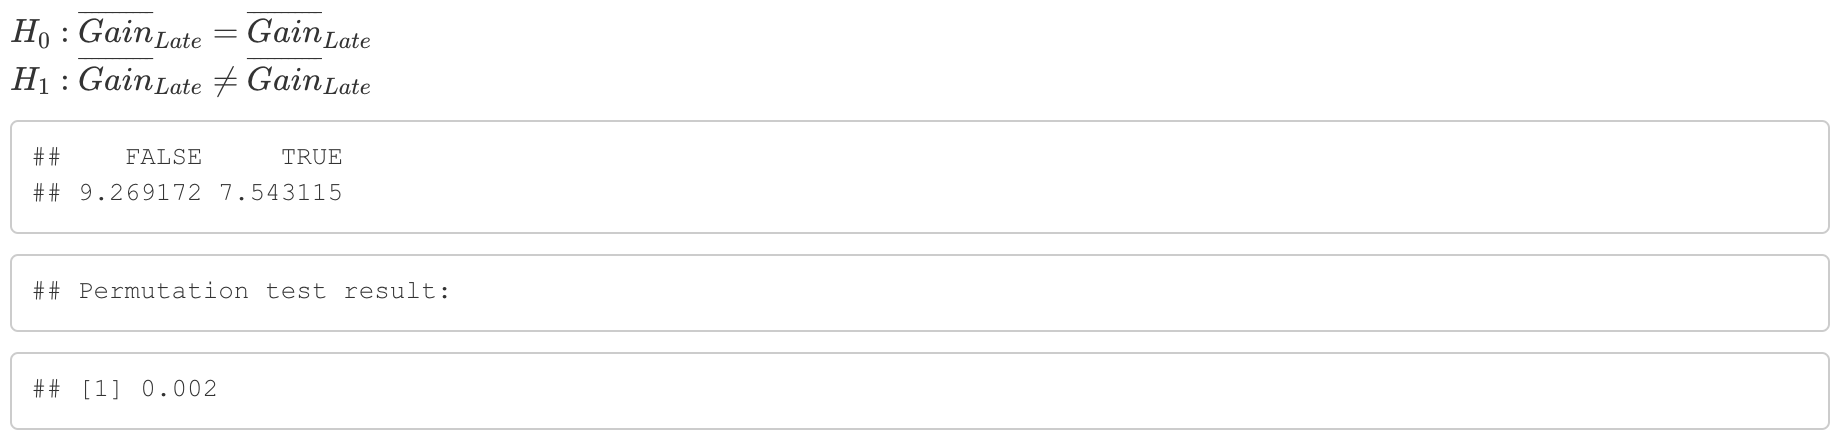
Based on the above Late Departure (dep_delay > 0) permutation test results, we may conclude that there is a statistically significant difference in average gain between late flights and non-late flights because the p-value is 0.002, which is less than 0.05.
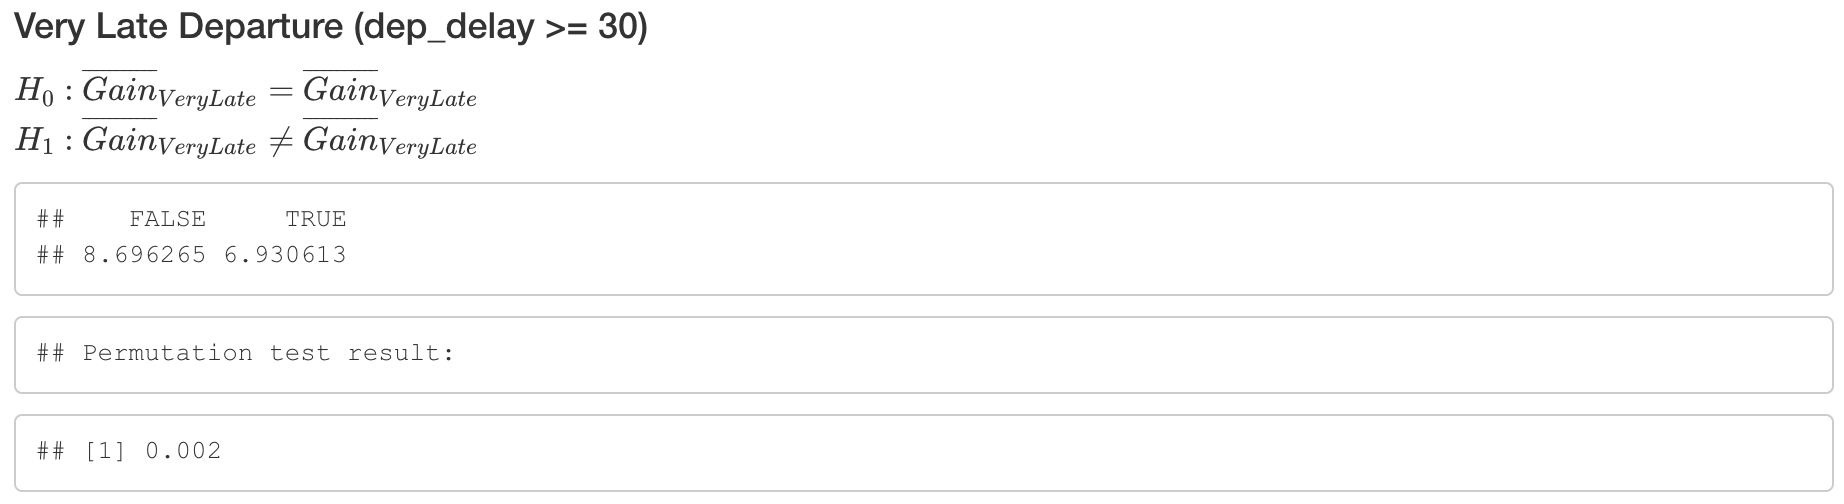
Based on the above Very Late Departure (dep_delay >= 30) permutation test results, we may conclude that there is a statistically significant difference in average gain between very late flights and non-very late flights because the p-value is 0.002, which is less than 0.05.
2. What are the five most common destination airports for United Airlines flights from New York City?

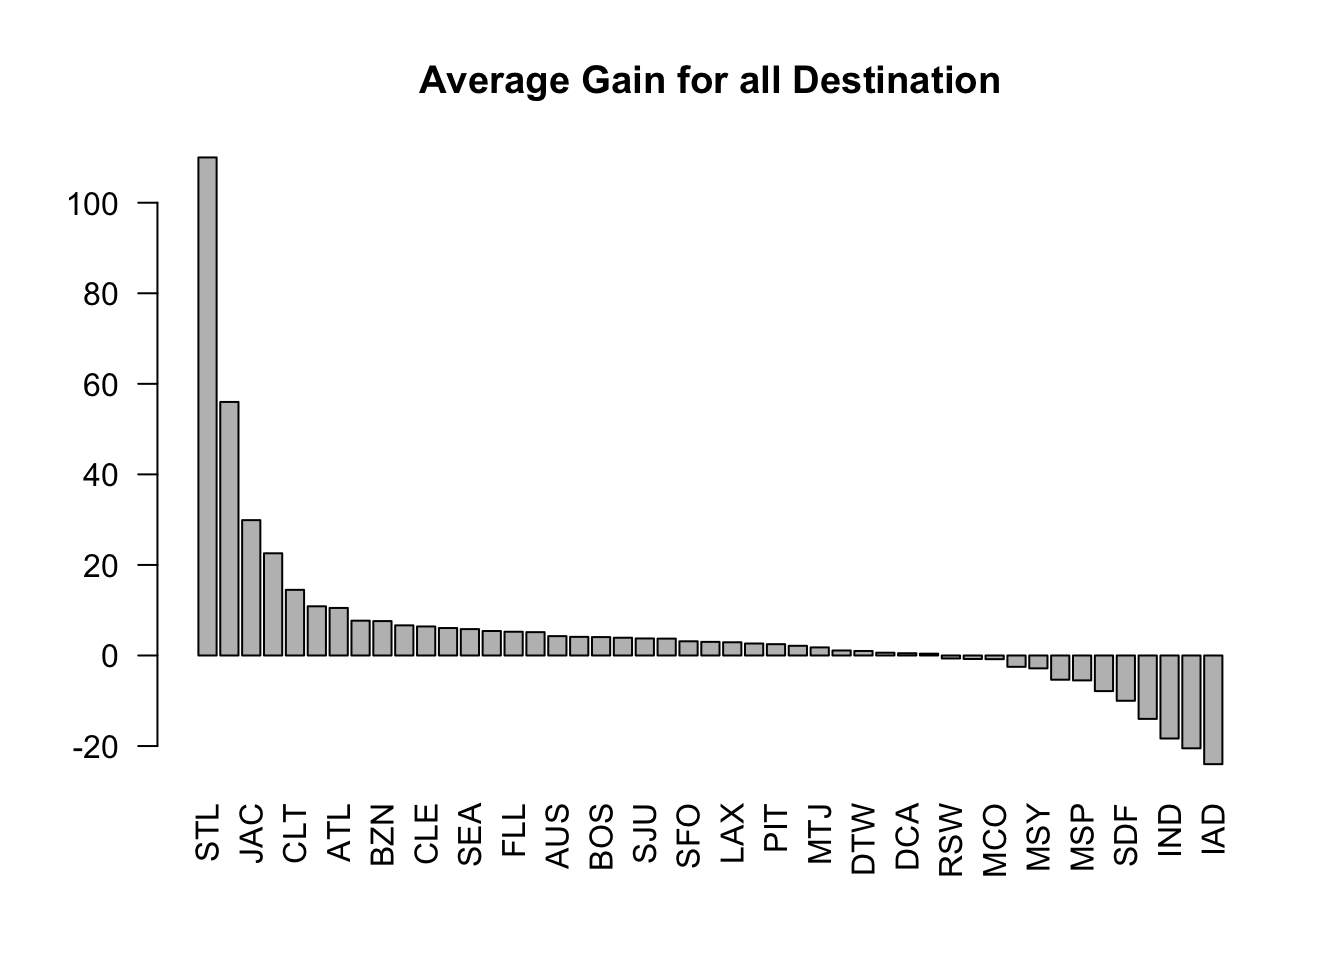

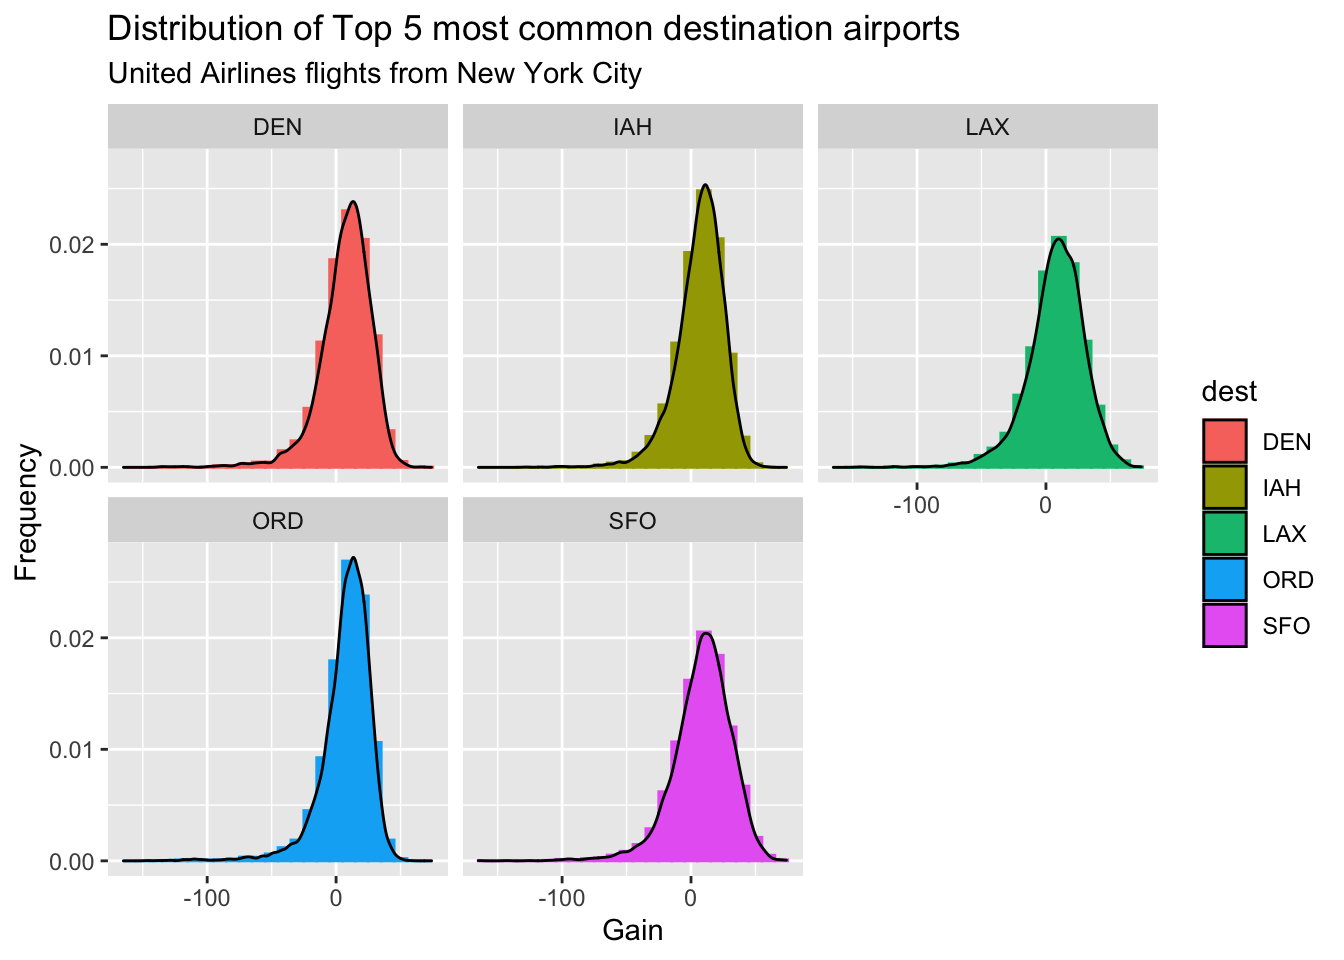
According to the above distribution of the gain for each of these top 5 airports is displayed in histograms. The distribution of each of these airports reveals a commonality in having a modal peak at a gain, and if we look at the average of top 5 most common destination airports average gain are between the range of 5 to 10. So for the frequency of the peak frequency varies depending on the number of airports that are destinations from New York airports.
3. Does the average gain per hour differ for flights that departed late versus those that did not? What about for flights that departed more than 30 minutes late?
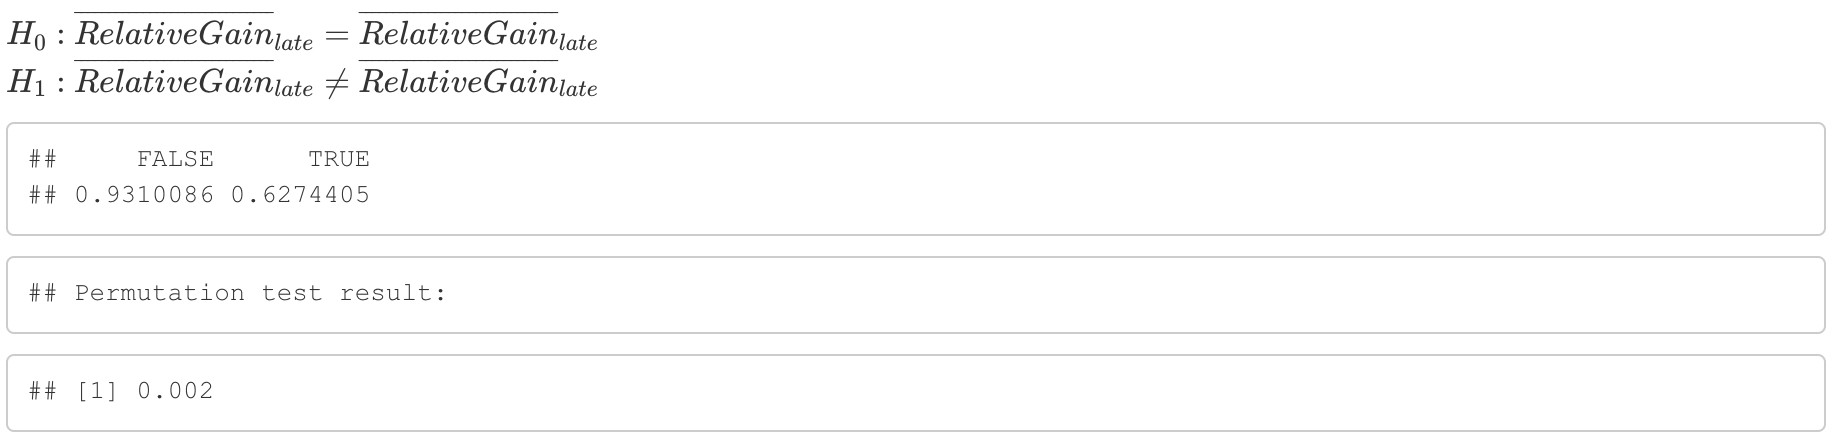
Based on the above Relative Gain Late Departure (gain_per_hour > 0) permutation test results, we may conclude that there is a statistically significant difference in average relative gain between late flights and non-late flights because the p-value is 0.002, which is less than 0.05.
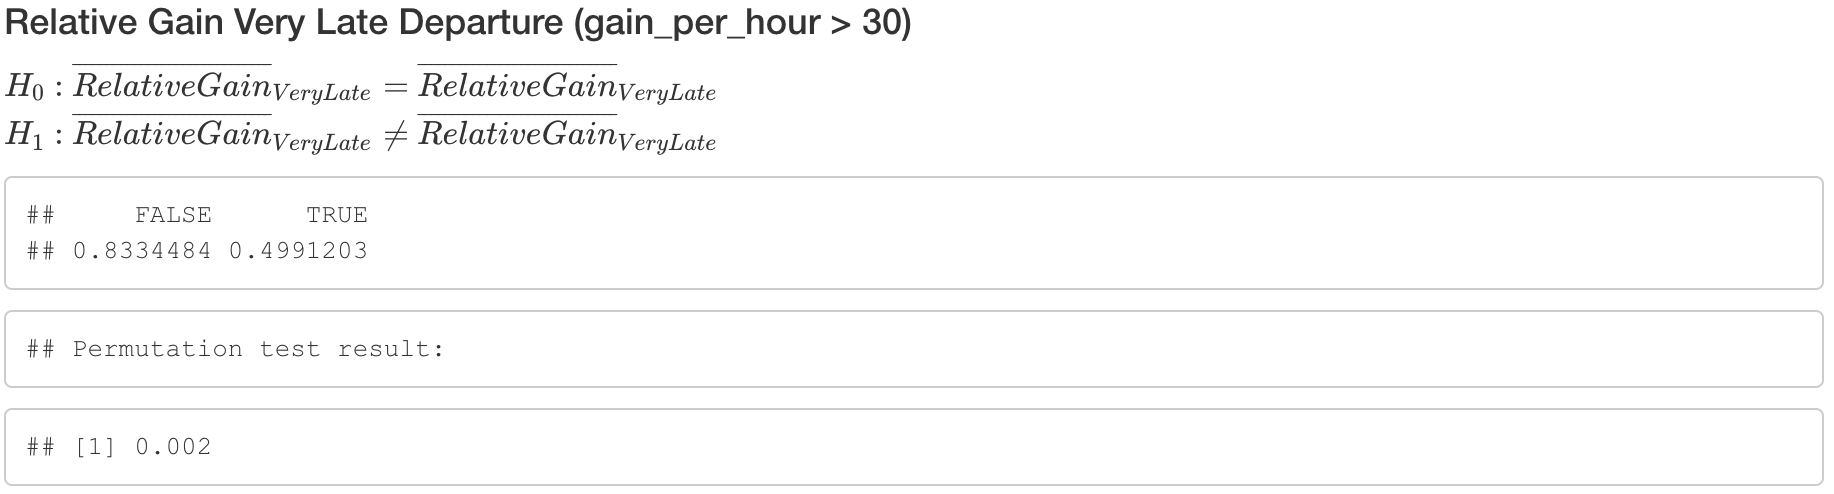
Based on the above Relative Gain Very Late Departure (gain_per_hour >= 30) permutation test results, we may conclude that there is a statistically significant difference in average relative gain between late flights and non-late flights because the p-value is 0.002, which is less than 0.05.
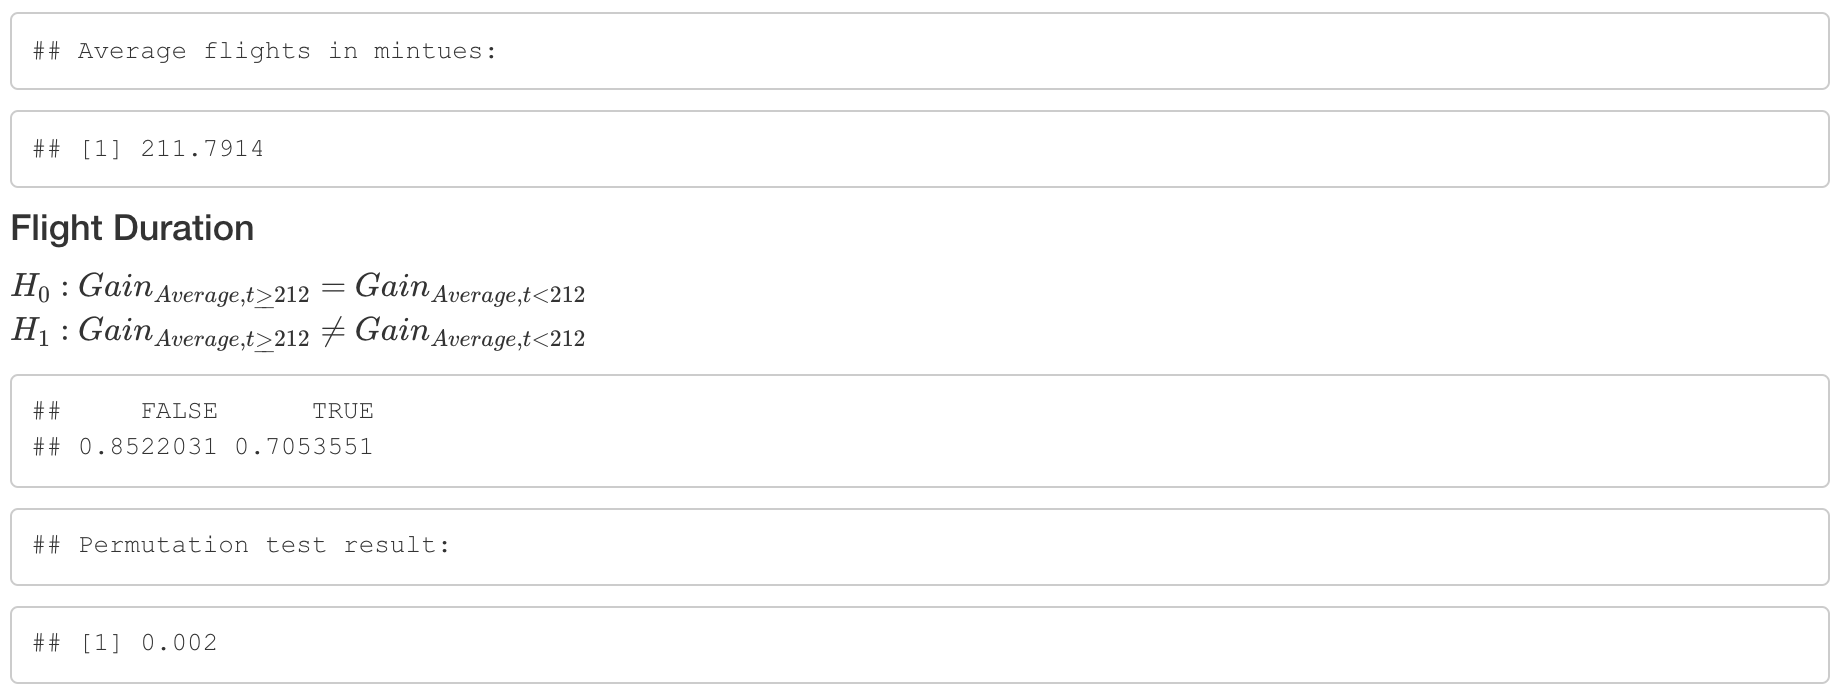
Based on the above Flight Duration Relative Gain permutation test results, we may conclude that there is a statistically significant difference in average relative gain between long flights and short flights because the p-value is 0.002, which is less than 0.05.