Client: Marvel Mart Department Store Chains (SQL, Python)
Created demographic and financial patient profiles from 50K+ records, identifying areas for improvement
Prescripted repurchase rates and costs by using feature engineering and ensemble models; identified best performing model through 10-fold cross validation and crafted strategies to control varieties utilization and cost
Author: Yinhui(Kami) Yang
I have been recently hired by Marvel Mart, one of the world's leading department store chains, to be their new data analyst. I was hired because of your technical skills with Python. Immediately, they offer you a CSV file and ask you to provide specific business analytics based on the data. I am allowed required to use Python and the numPy and pandas libraries for this project. Use any other Python libraries that you would like as well. Take a few moments to familiarize myself with the CSV file called MM_Sales.csv Notice the columns, the headings, the format of the data in each column.
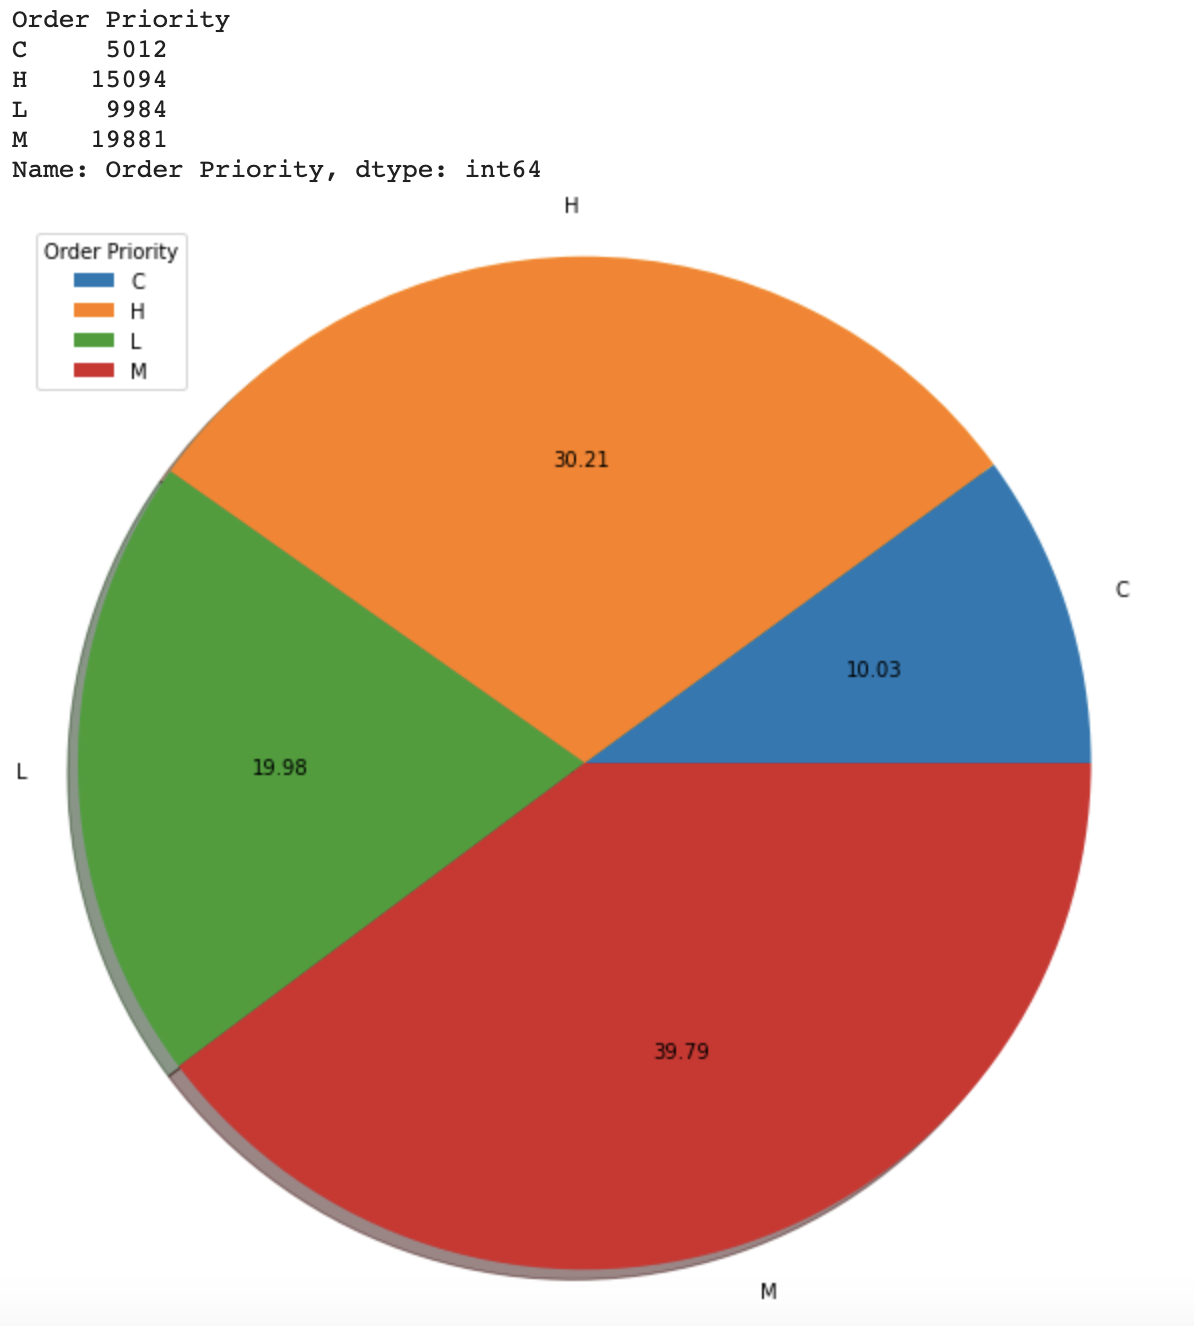
Marvel Mart has been providing both online and offline sales of a variety of products for many years. The provide services to countries all over the world and have stores in many countries. Marvel Mart divides their order up by an alphabetical priority labeling system:
C: Critical (most essential to be delivered quickly and accurately)

H: High

M: Medium

L: Low
There are several columns of data for sales:
Unit Price: money collected for sale of 1 unit

Unit Cost: money spent for purchase of 1 unit

Total Revenue: money collected for sale of the collection of units

Total Cost: money spent for purchase of the collection of units

Total Profit: Total Cost - Total Revenue (profit)
First and foremost, I'd want to add all of the csv, numpy, pandas, seaborn, and matplotlib.pyplot files to the project's beginning for individual coding. And I used the pd.set option script to prevent Python from performing substantial number sums with any of the floats in the scientific notation while I was working on the project.
Input initial ‘df’ data frame and read MM_Sales.csv file then follow the project requirements to find out any incorrect or missing data which is in the text type for that column in MM_Sales.csv file and then change it to the string "NULL" or number 0 (or 0.0 if it's a float). Writing code to clean the Order Priority, Item Type, individually by using the isnull() check out NULL and and filling any missing values with "NULL". Accordingly, for the required Country cleaning data which will need to apply the (lambda x: x if isinstance(x, str) else "NULL") into the code. Lastly, since the Order ID carries the numeric in the data columns then I am writing the errors='coerce' to avoid the invalid parsing errors which will be found in the data and set as NaN at the same time. Next, I am going to copy the data and double check on the NULL and 0 which I have completely cleaned out then output a new file to the MM_Sales_Clean.csv file for the rest of the project.
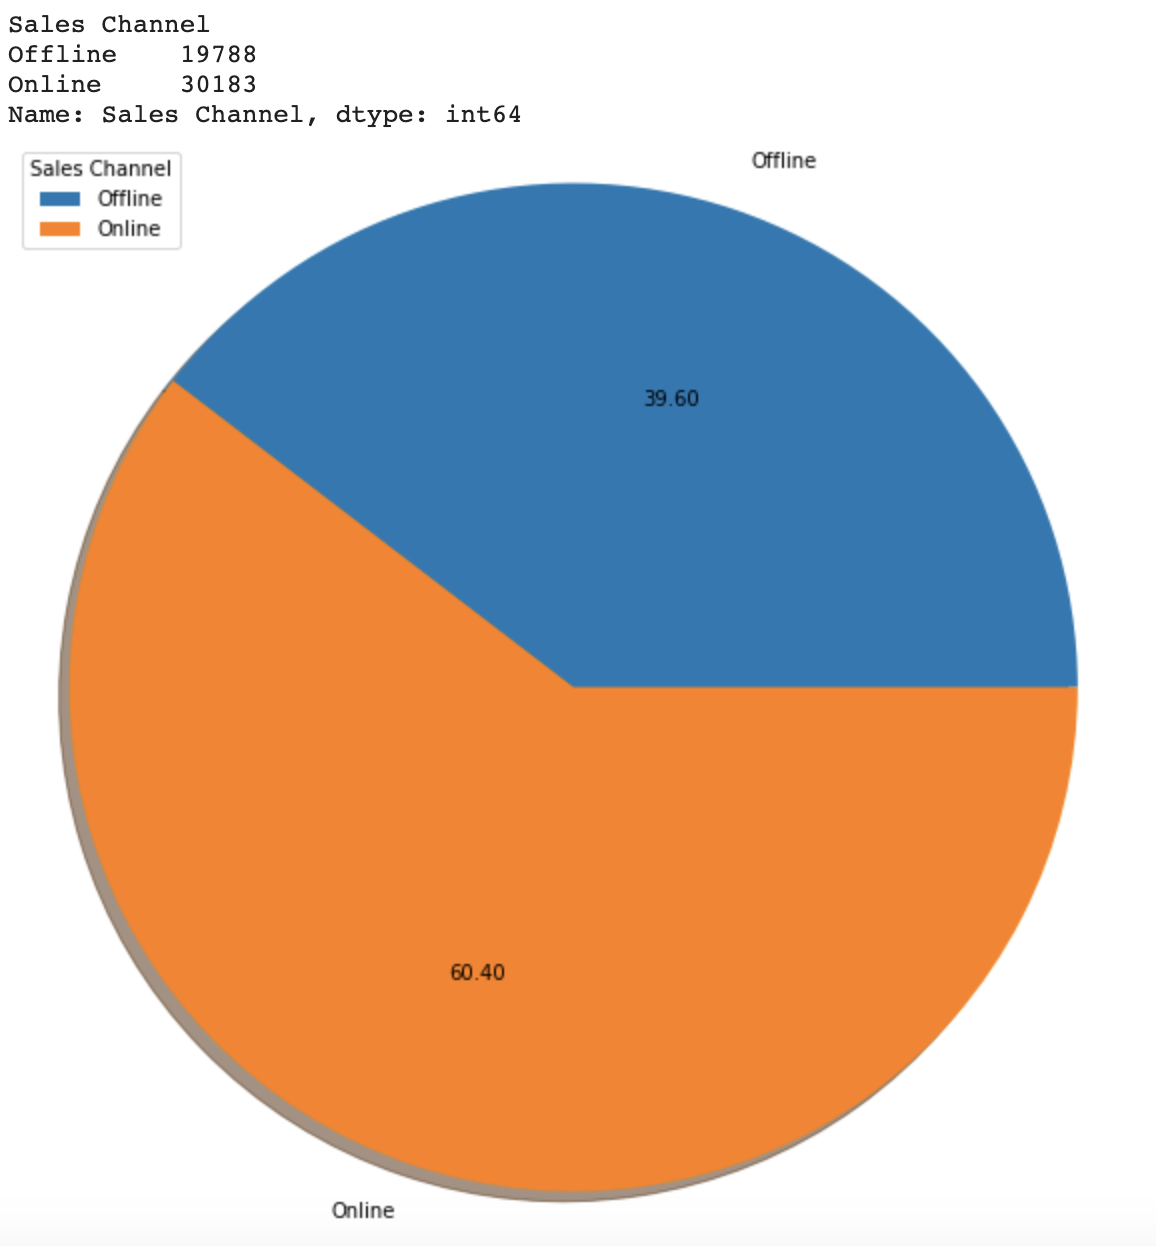
Input the new MM_Sales_Clean.csv file for coding work, counting the sales transitions and identify the top 10 countries, next step create the new countries list carry the 'Trinidad and Tobago', 'Guinea', 'Maldives' to found out the shipping center build list for country from the country in top 10 countries but not in the countries list and then the solution written into the Rankings file. Next I am going to use the new MM_Sales_Clean.csv file for the online and offline sales channel count then write the solution written into the Rankings file. Input chart value group by and count from new MM_Sales_Clean.csv file, in order to get the pic chart. The particular reason for the circumstances is that I am doing similar logical coding work for the next two questions Order Priority and other Sales Channel Pie charts.
Import warnings and write the action='ignore' for the Part 2 Boxplot of Total Profits DISTRIBUTION avoid the error warnings.
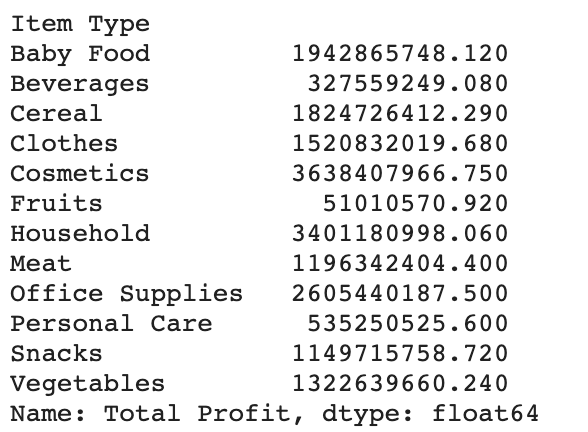
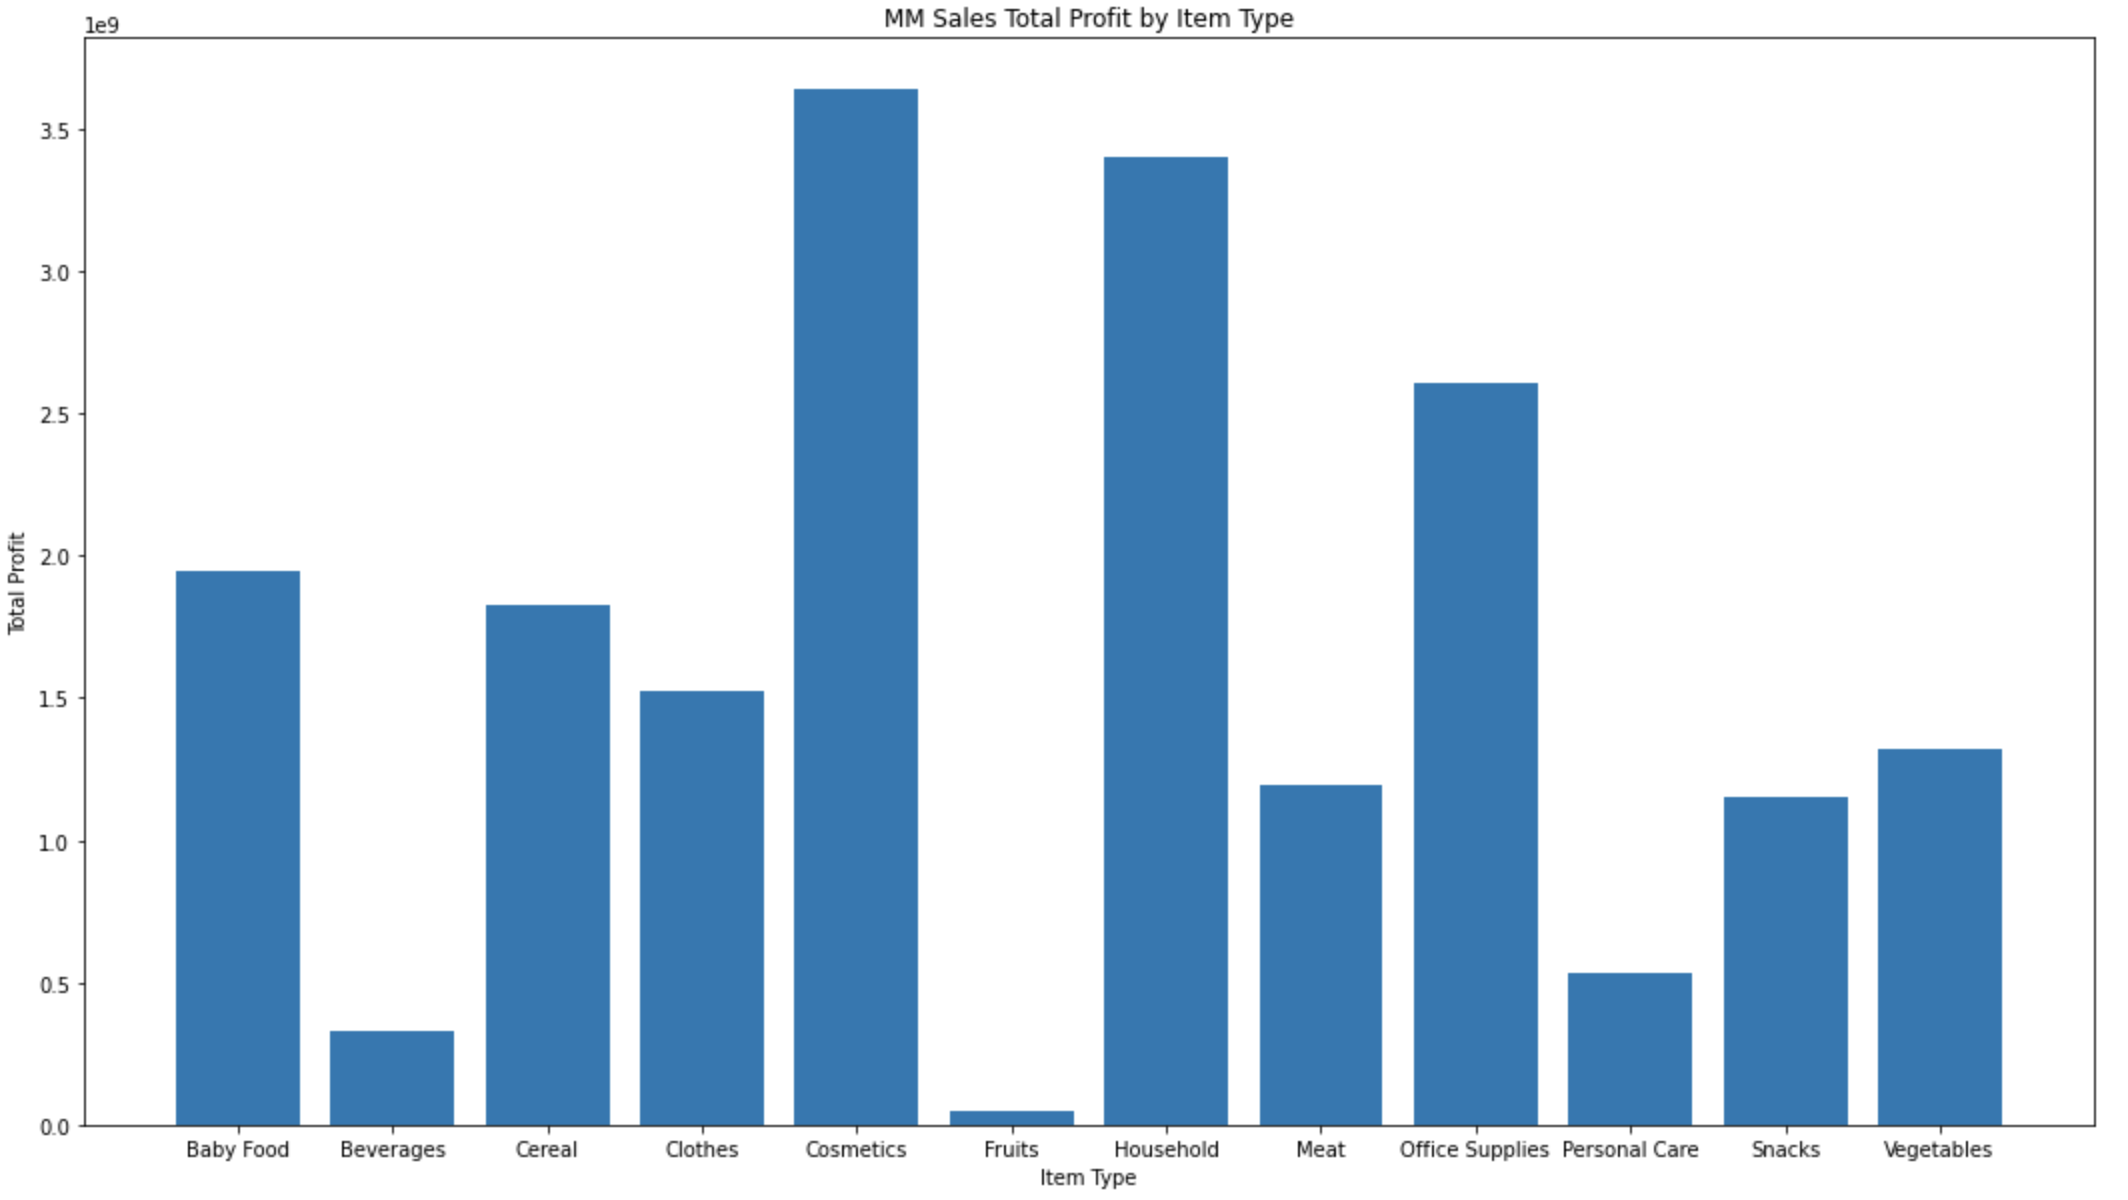
Then comes to the part 2 Q3 I am using the value group by and cum from a clean new MM_Sales_Clean.csv file, in order to get a bar chart displaying the result. Using the previous data result, write into a dictionary and get the top 3 Item Types from Total profit then write the solution into the Randing file.
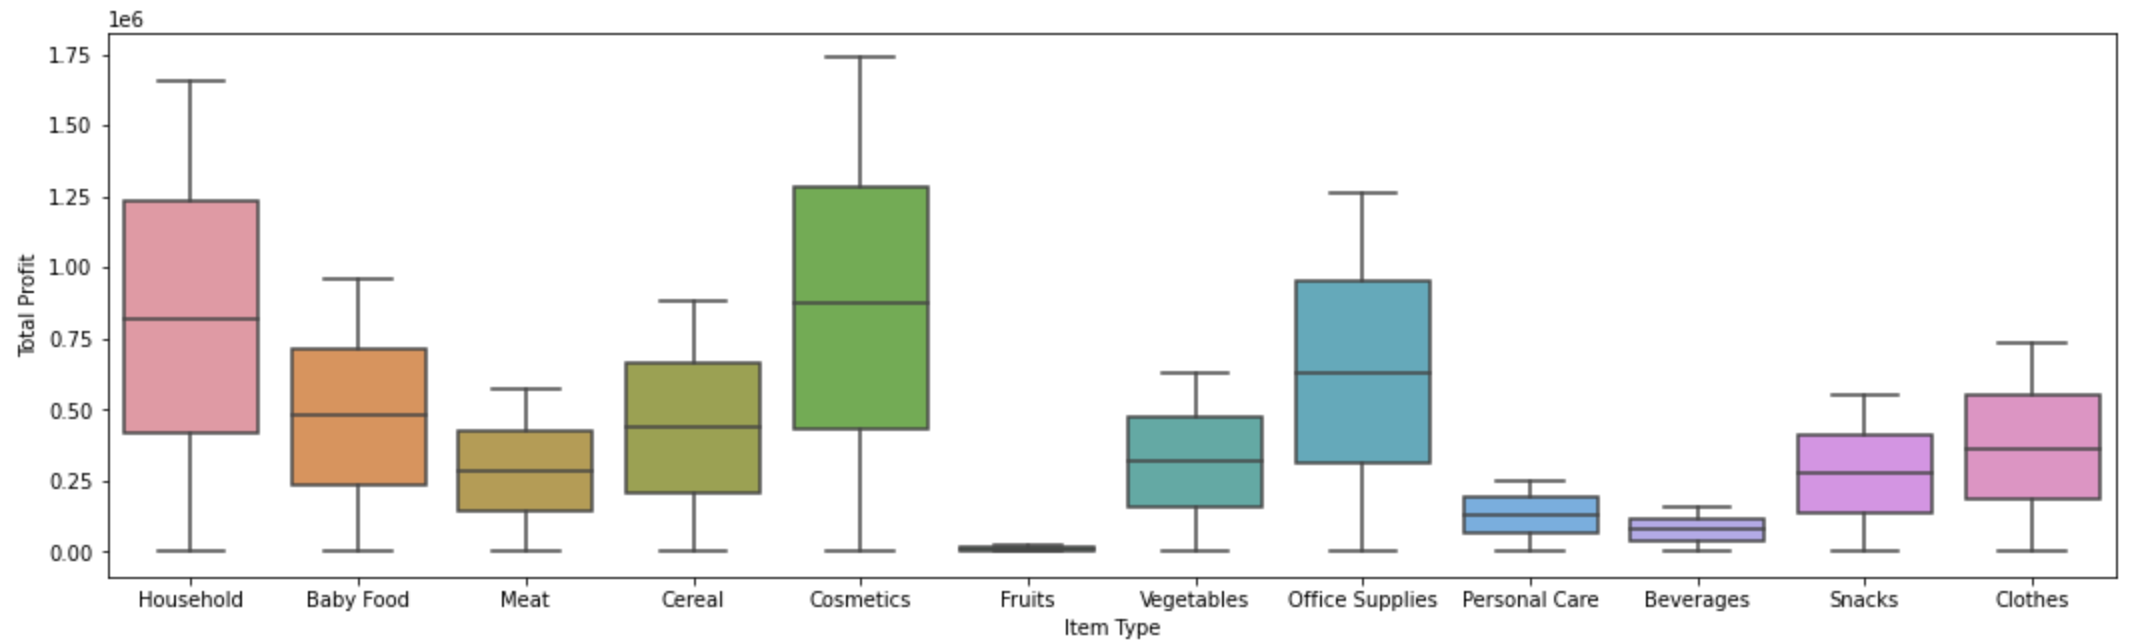
Finally, markdown the Boxplot of Total Profits DISTRIBUTION Discussion.
Boxplot is a standardized method for displaying data distribution based on five figures: minimum, first quartile, median, third quartile, and maximum. In the simplest Boxplot, the central rectangle spans from the first quartile to the third quartile. Segments in the rectangle show the middle value, and whiskers are displayed above and below the box, showing the positions of the minimum and maximum values. Accordingly, this boxplot image shows us the combinations with the Top 3 Total Profits by Item Type and the rectangle span are Cosmetic, Household, and Office Supplies. Segments in the rectangle show intermediate values of 0.9, 0.8, and 0.7, respectively.
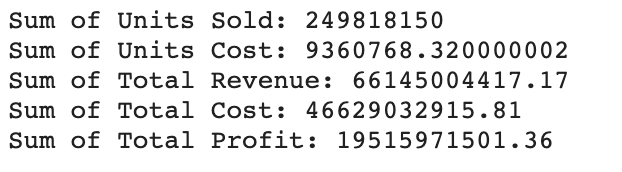
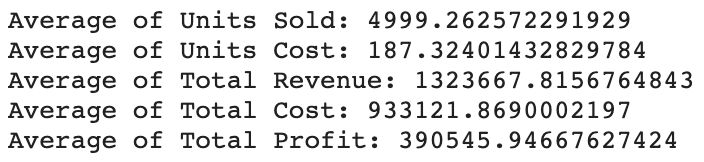
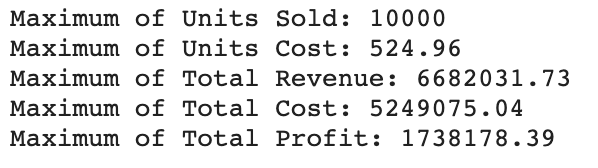
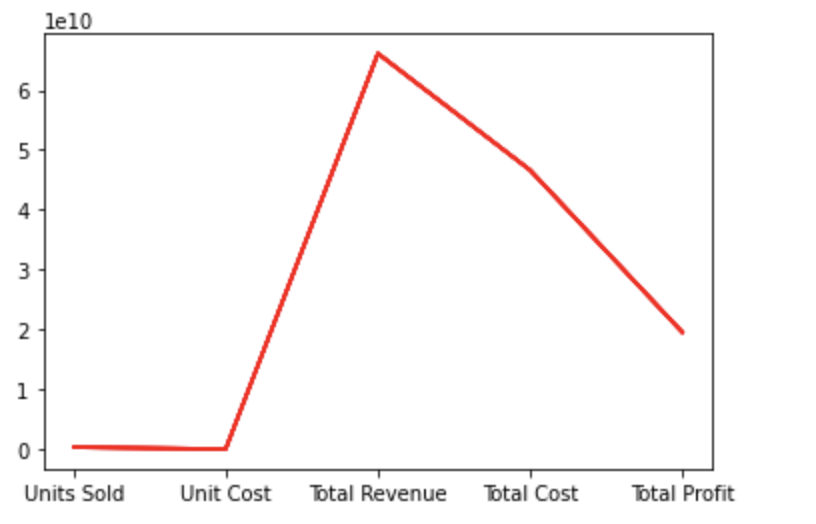
Part 2 Q4 follows the project requirements determining the sum, average, maximum of Units Sold, Unit Cost, Total Revenue, Total Cost, Total Profit then write each solution into MM_Calc.txt file individually. Lastly, using the calculation data display the Line Plot.
Import warnings and write the action='ignore' for the Part 3 dictionary data to avoid the error warnings. After inputting all of the dictionary data with a header for the data of the region and then convert the dictionary data to the CSV file, create a CSV file called Countries_By_Region.csv.