LineData
The ‘ldata’ method is used to add data to the graph just like ‘data’. This data will be drawn as lines on top of the normal chart data.
Example (test_ldata_2 from test_bar.rb):
    g = Gruff::Bar.new(800)
    g.data(:apples, (0..9).map { rand(20)/10.0 })
    g.data(:peaches, (0..9).map { rand(20)/10.0 })
    g.data(:oranges, (0..9).map { rand(20)/10.0 })
    g.ldata(:good, (0..9).map { rand(20)/10.0 }, :style => [5,5])
    g.ldata(:bad, (0..9).map { rand(20)/10.0 }, :style => 'dash', :dot_width => 5)
    write_test_file g, 'bar_with_2_ldata.png'
Results in this image:
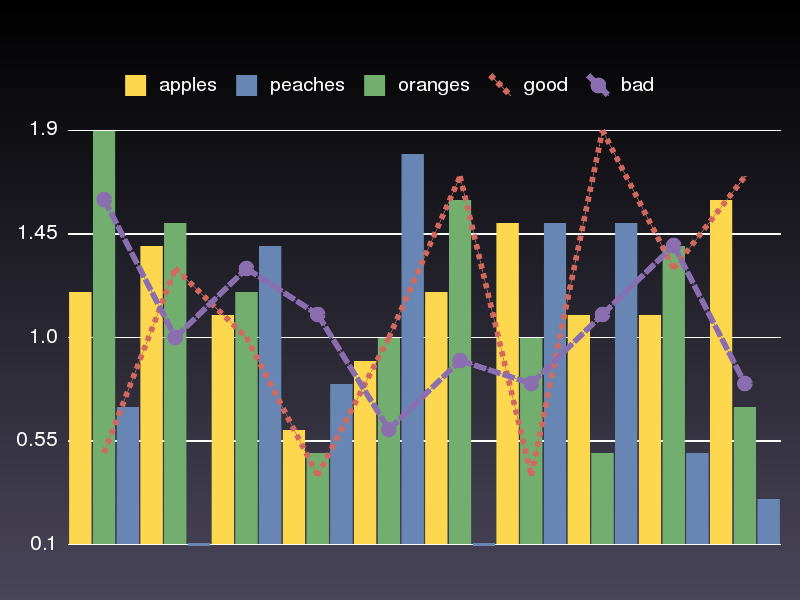
Currently only implemented for bar and stacked_bar chart types.