Systematic exploration of clustering resolutions in single-cell analysis
ResolutionTree is a Python package that automates the exploration of different clustering resolutions in single-cell RNA sequencing data. Instead of manually testing different resolution parameters, ResolutionTree systematically evaluates how subclusters emerge from parent clusters as resolution increases, providing a hierarchical view of cluster relationships along with key differentially expressed genes (DEGs) that distinguish them.
One of the most common questions in single-cell analysis is: "How do you decide on the clustering resolution?" The reality is:
- There's no universal "golden standard" for selecting the best resolution
- The choice depends on your specific biological question
- Traditional approaches require manual iteration through multiple resolutions
- The process is time-consuming and subjective
ResolutionTree provides:
- Automated resolution exploration across user-defined ranges
- Hierarchical cluster visualization showing parent-child relationships
- Differential gene expression analysis highlighting key distinguishing features
- Customizable visualization options for publication-ready figures
- Integration with Scanpy workflow
pip install resolutiontree==0.1.0a1pip install git+https://github.com/joe-jhou2/resolutiontree.gitpip install scanpy pandas numpy scipy matplotlib seaborn networkx igraph-pythonimport scanpy as sc
import resolutiontree as rt
# Load your data
adata = sc.datasets.pbmc3k()
# Standard preprocessing
sc.pp.normalize_total(adata, inplace=True)
sc.pp.log1p(adata)
sc.pp.pca(adata)
sc.pp.neighbors(adata)
sc.tl.umap(adata)
# Define resolutions to explore
resolutions = [0.0, 0.2, 0.5, 1.0, 1.5, 2.0]
# If you don't want to modify the original AnnData object, make a copy first
adata_new = adata.copy()
# Step 1: Find optimal resolution with DEG analysis
rt.cluster_resolution_finder(adata_new,
resolutions=resolutions,
n_top_genes=3,
min_cells=2,
deg_mode="within_parent"
)
# Step 2: Visualize the hierarchical clustering tree
rt.cluster_decision_tree(adata_new, resolutions=resolutions,
output_settings = {
"output_path": "result.png",
"draw": False,
"figsize": (12, 6),
"dpi": 300
},
node_style = {
"node_size": 500,
"node_colormap": None,
"node_label_fontsize": 12
},
edge_style = {
"edge_color": "parent",
"edge_curvature": 0.01,
"edge_threshold": 0.01,
"show_weight": True,
"edge_label_threshold": 0.05,
"edge_label_position": 0.8,
"edge_label_fontsize": 8
},
gene_label_settings = {
"show_gene_labels": True,
"n_top_genes": 2,
"gene_label_threshold": 0.001,
"gene_label_style": {"offset":0.5, "fontsize":8},
},
level_label_style = {
"level_label_offset": 15,
"level_label_fontsize": 12
},
title_style = {
"title": "Hierarchical Leiden Clustering",
"title_fontsize": 20
},
layout_settings = {
"node_spacing": 5.0,
"level_spacing": 1.5
},
clustering_settings = {
"prefix": "leiden_res_",
"edge_threshold": 0.05
}
)The cluster_resolution_finder() function systematically tests multiple clustering resolutions and identifies key differentially expressed genes:
DEG Comparison Modes:
"within_parent": Compare sibling clusters from the same parent (recommended)"per_resolution": Compare all clusters at each resolution
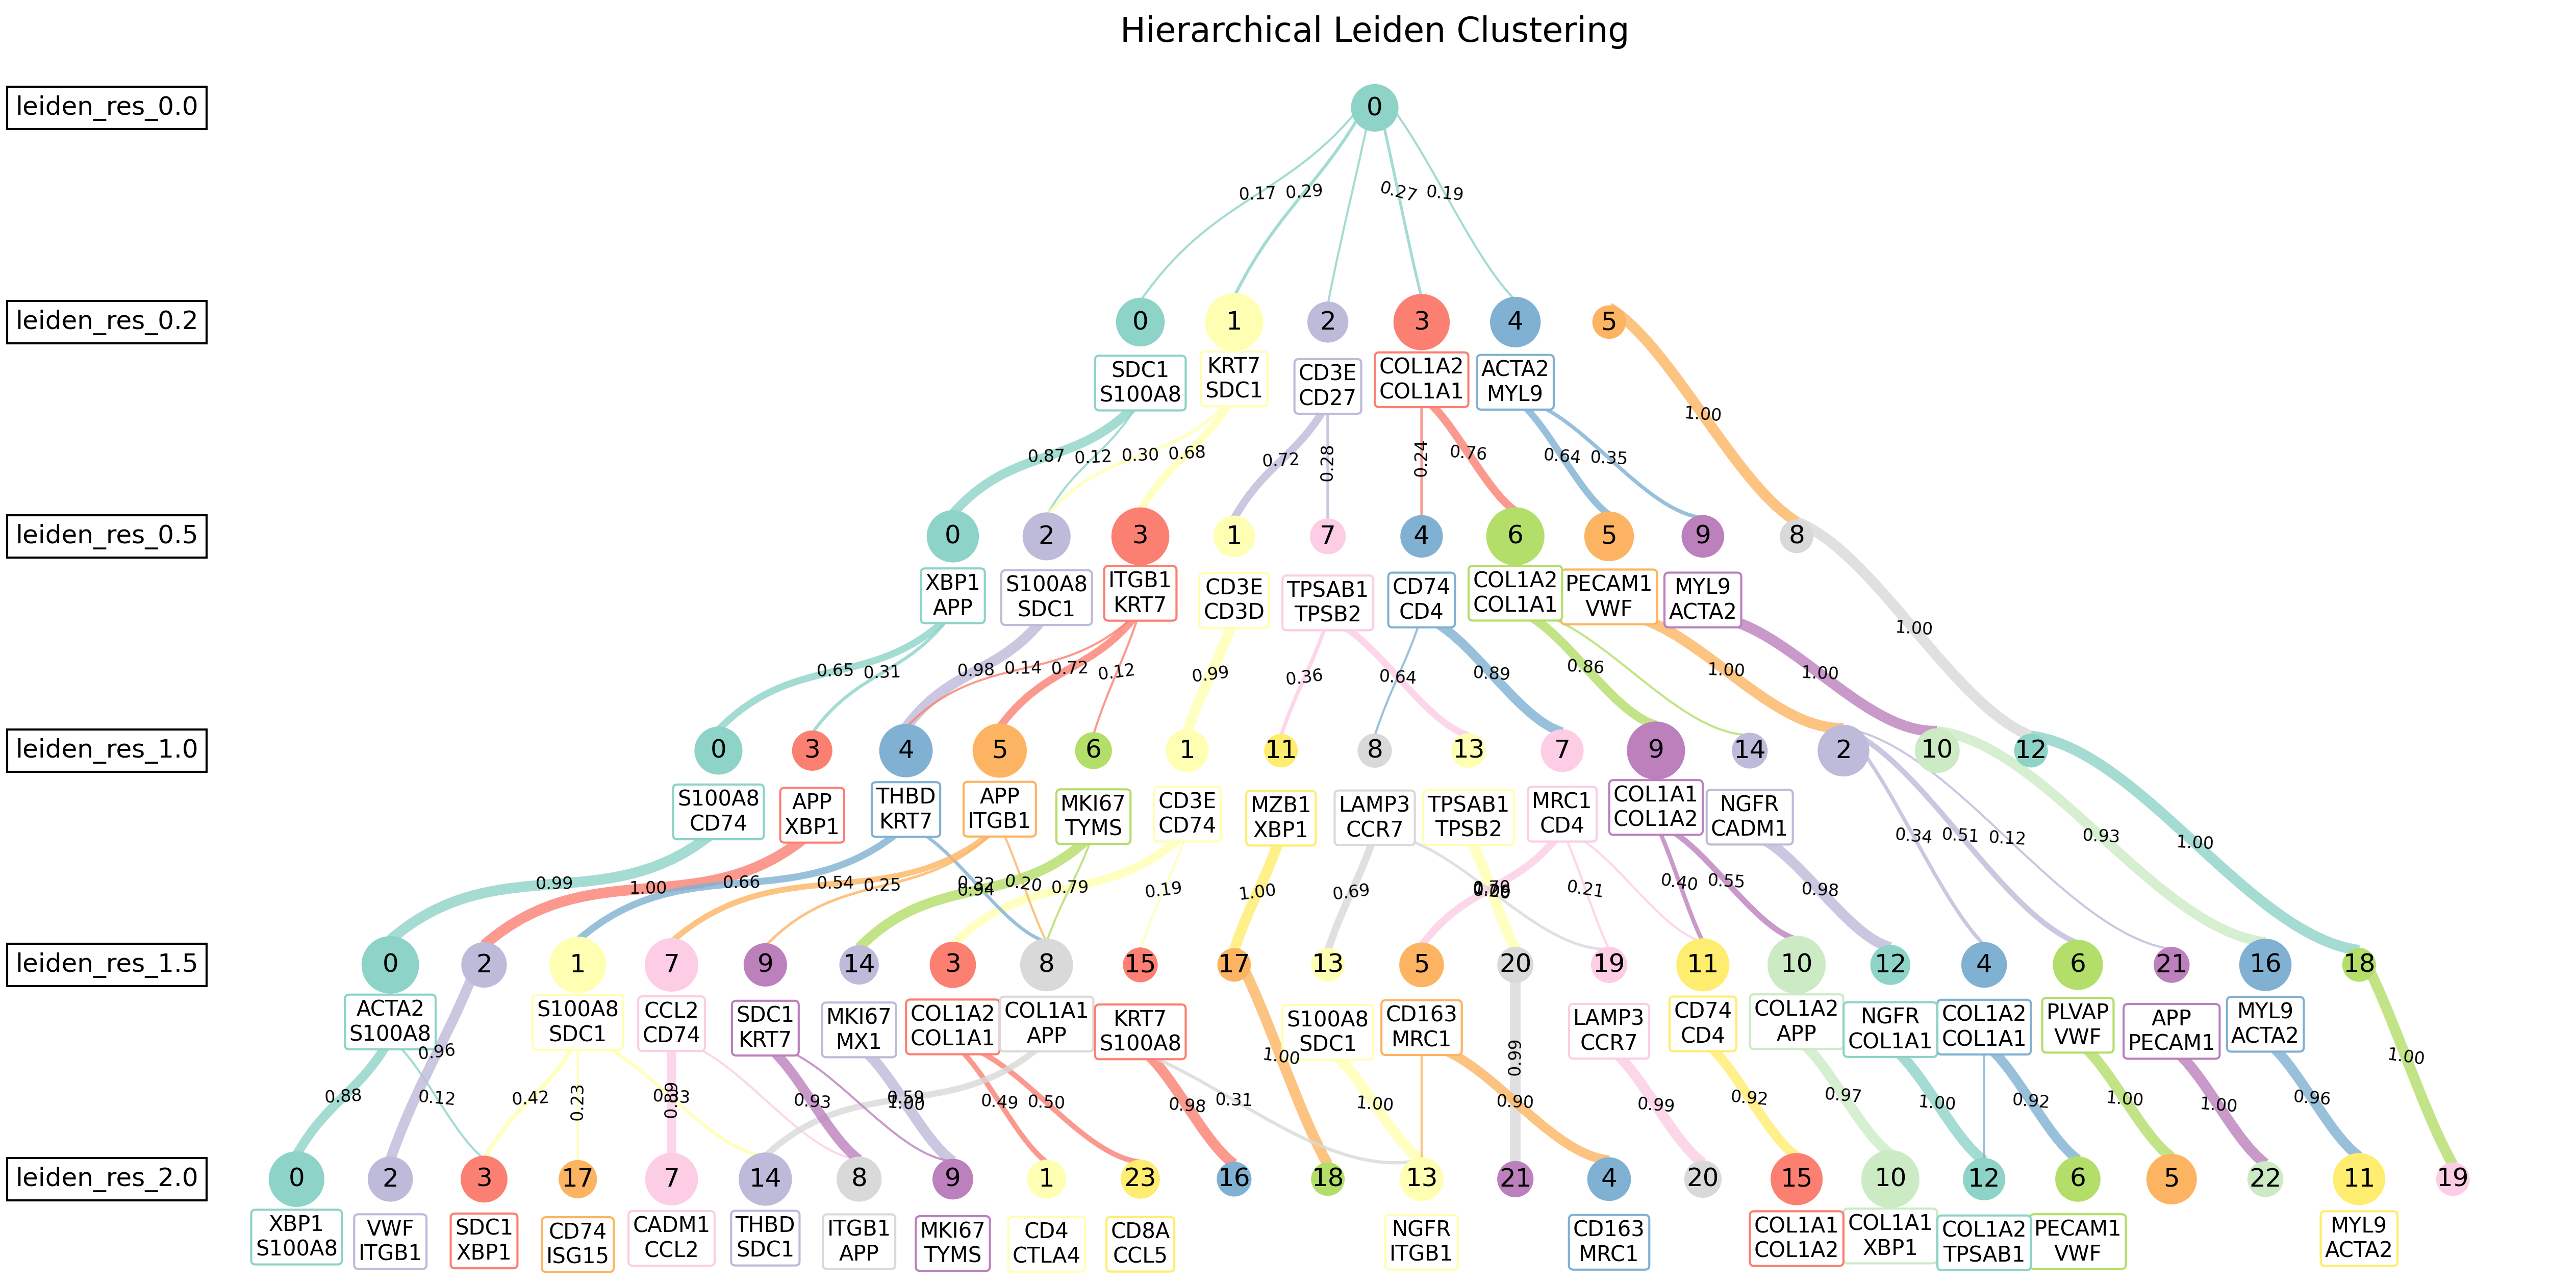
The cluster_decision_tree() function creates publication-ready hierarchical cluster trees:
The detailed customization options allow you to tailor the visualization to your needs: see my blog: Optimizing Clustering Resolution in Single-Cell Analysis
The package generates hierarchical trees showing:
- Cluster evolution across resolutions
- Parent-child relationships between clusters
- Key differentiating genes for each split
- Cluster sizes and transition weights
- T cell subsets: Higher resolutions reveal distinct T helper, regulatory, and cytotoxic populations
- Immune cell states: Identify activation states and differentiation trajectories
- Rare cell populations: Detect small but biologically important cell clusters
- Over-clustering detection: Identify when resolution becomes too high
- Biological validation: Use DEGs to confirm cluster biological relevance
- Resolution optimization: Find the sweet spot between under- and over-clustering
ResolutionTree seamlessly integrates with standard Scanpy workflows:
# Standard Scanpy preprocessing
sc.pp.filter_cells(adata, min_genes=200)
sc.pp.filter_genes(adata, min_cells=3)
sc.pp.normalize_total(adata, target_sum=1e4)
sc.pp.log1p(adata)
sc.pp.highly_variable_genes(adata)
sc.pp.pca(adata)
sc.pp.neighbors(adata)

# ResolutionTree analysis
rt.cluster_resolution_finder(adata, resolutions=[0.2, 0.5, 1.0, 1.5])
rt.cluster_decision_tree(adata, resolutions=[0.2, 0.5, 1.0, 1.5])

# Continue with Scanpy
sc.tl.umap(adata)
sc.pl.umap(adata, color='leiden_res_1.0')If you use ResolutionTree in your research, please cite:
@software{resolutiontree2025,
  author = {Joe Hou},
  title = {ResolutionTree: Systematic exploration of clustering resolutions in single-cell analysis},
  url = {https://github.com/joe-jhou2/resolutiontree},
  year = {2025}
}For a detailed explanation of the methodology and examples, see the blog post: Optimizing Clustering Resolution in Single-Cell Analysis
Contributions are welcome! Please feel free to submit a Pull Request. For major changes, please open an issue first to discuss what you would like to change.
This project is licensed under the MIT License - see the LICENSE file for details.
- Initial release
- Core resolution finding functionality
- Hierarchical cluster tree visualization
- Scanpy integration
- Comprehensive documentation and examples
Keywords: single-cell RNA-seq, clustering, resolution selection, differential gene expression, hierarchical clustering, scanpy, bioinformatics