InfiWatch is a free-to-use platform-as-a-service (PaaS) that makes it easy to ingest, search, visualize, and analyze your Hyperledger Fabric's data. This is the Infilock Enterprise analysis platform in the form of PaaS that you can start using in a matter of seconds, with no prior technical expertise required! InfiWatch monitors +20 security metrics through predefined dashboards.
We built InfiWatch on top of OpenSearch. OpenSearch is a distributed, open-source search and analytics suite used for a broad set of use cases like real-time application monitoring, log analytics, and website search. OpenSearch provides a highly scalable system for providing fast access and response to large volumes of data with an integrated visualization tool, OpenSearch Dashboards, that makes it easy for users to explore their data.

To use InfiWatch, users must register and get their own set of credentials. To do that, users need to contact info@infilock.io and ask for registration. Infilock's support team will gladly hand you the required credentials within hours.
The credentials' package contains:
- client.crt: Your client's public certificate.
- client.key: Your client's private certificate.
- ca.crt: Our certificate authority's certificate.
- Instance id: Your special Instance ID to access the data of yours.
- metricbeat.yml: Example integration configuration file.
- username and password
Be careful: Do not share these credentials with anybody.
Download and extract the credentials:
$ pwd
/home/myuser

$ unzip infiwatch_credentails.zip

$ cd infiwatch_credentails

$ pwd
/home/myuser/infiwatch_credentails
Given metricbeat example (metricbeat.yml) looks like this:
metricbeat.modules:
  - module: prometheus
    period: 10s
    enabled: true
    hosts: # Change me
      - orderer0.hyperledger.network.local:8443
      - orderer1.hyperledger.network.local:8443
      - orderer2.hyperledger.network.local:8443
      - peer0.hyperledger.network.local:9443
      - peer1.hyperledger.network.local:9443
    metrics_path: /metrics
    metricsets: ["collector"]
    metrics_filters:
      include: ["^ledger_transaction_count$", "^ledger_blockchain_height$", "^process*", "^fabric_version$", "^endorser_proposals_received$", "^endorser_successful_proposals$", "^go_info$", "^broadcast_validate_duration$", "^endorser_proposal_duration$", "^grpc_comm_conn_closed$", "^grpc_comm_conn_opened$", "^endorser_endorsement_failures$", "^broadcast_processed_count$"]

  output.logstash:
    hosts: ["telemetry.infilock.io:5044"]
    ssl.certificate_authorities: ["/etc/ca.crt"]
    ssl.certificate: "/etc/client.crt"
    ssl.key: "/etc/client.key"

  processors:
  - add_fields:
      target: meta
      fields:
        instanceid: 3a7d7c18-fg62-49aa-ac89-ff11426f60d3 # Change me
To use this example, you need to customize it according to your setup. First things first, the hosts section needs to be edited. To do that, you need to add your Hyperledger nodes' IPs.
To find required IPs you can use the following helper command:
docker inspect -f '{{range.NetworkSettings.Networks}}{{.IPAddress}}{{end}}' container_name_or_idChange the container_name_or_id and put the target node's name or id. Repeat this process to find all nodes' IPs.
To understand it better, please look at the following example:
$ docker ps --format '{{.Names}} {{.ID}} {{.Image}}'

peer0.infilock.local 75a447ebcf70 hyperledger/fabric-peer:2.3.2
orderer.infilock.local   b3f644e6d213 hyperledger/fabric-orderer:2.3.2

$ docker inspect -f '{{range.NetworkSettings.Networks}}{{.IPAddress}}{{end}}' peer0.infilock.local

172.17.0.2

$ docker inspect -f '{{range.NetworkSettings.Networks}}{{.IPAddress}}{{end}}' orderer.infilock.local

172.17.0.101
Edit the instanceid and put the unique identifier handed to you via email.
Finally, to run the metricbeat, first, make sure you are in the /path/to/your/infiwatch_credentails path, and then execute this command:
docker run -d \
    --name=metricbeat-infiwatch \
    --user=root \
    --network="myhyperledgernetwork" \
    --volume="$(pwd)/metricbeat.yml:/usr/share/metricbeat/metricbeat.yml:ro" \
    --volume="/var/run/docker.sock:/var/run/docker.sock:ro" \
    --volume="/sys/fs/cgroup:/hostfs/sys/fs/cgroup:ro" \
    --volume="/proc:/hostfs/proc:ro" \
    --volume="/:/hostfs:ro" \
    --volume="$(pwd)/keys/ca.crt:/etc/ca.crt" \
    --volume="$(pwd)/keys/client.crt:/etc/client.crt" \
    --volume="$(pwd)/keys/client.key:/etc/client.key" \
    docker.elastic.co/beats/metricbeat-oss:8.2.3 metricbeat
You need to edit --network="myhyperledgernetwork" according to your Hyperledger Fabric's network name. To find the corresponding network name, you can execute the following command:
$ docker network ls

NETWORK ID     NAME                   DRIVER    SCOPE
91d25377c93c   bridge                 bridge    local
0804a9a67e4c   host                   host      local
193aca780ffa   myhyperledgernetwork   bridge    local
f327e7ad9796 none null local- Hyperledger Fabric is installed on Kubernetes
kubectlandhelmare installed
Download and extract the credentials.
Given metricbeat example (metricbeat.kubernetes.yml) looks like this:
daemonset:
  enabled: false
deployment:
  metricbeatConfig:
    metricbeat.kubernetes.yml: |
      metricbeat.modules:
        - module: prometheus
          period: 10s
          enabled: true
          hosts: # Change me
            - XXX-orderer0.YYY.svc.cluster.local:8443
            - XXX-orderer1.YYY.svc.cluster.local:8443
            - XXX-orderer2.YYY.svc.cluster.local:8443
            - XXX-peer0.YYY.svc.cluster.local:9443
            - XXX-peer1.YYY.svc.cluster.local:9443
          metrics_path: /metrics
          metricsets: ["collector"]
          metrics_filters:
            include: ["^ledger_transaction_count$", "^ledger_blockchain_height$", "^process*", "^fabric_version$", "^endorser_proposals_received$", "^endorser_successful_proposals$", "^go_info$", "^broadcast_validate_duration$", "^endorser_proposal_duration$", "^grpc_comm_conn_closed$", "^grpc_comm_conn_opened$", "^endorser_endorsement_failures$", "^broadcast_processed_count$"]
      output.file:
        enabled: false
      output.logstash:
        enabled: true
        hosts: ["telemetry.infilock.io:5044"]
        ssl.certificate_authorities: ["/usr/share/metricbeat/ca/certs/tls.crt"]
        ssl.certificate: "/usr/share/metricbeat/config/certs/tls.crt"
        ssl.key: "/usr/share/metricbeat/config/certs/tls.key"
      processors:
      - add_fields:
          target: meta
          fields:
            instanceid: 3b8d7c10-fg89-49bb-ac89-ff22517d90d3 # Change me
  secretMounts:
    - name: metricbeat-certificate-pem
      secretName: metricbeat-certificate
      path: /usr/share/metricbeat/config/certs
    - name: metricbeat-ca-pem
      secretName: metricbeat-ca
      path: /usr/share/metricbeat/ca/certs
imageTag: 8.2.3
image: docker.elastic.co/beats/metricbeat-oss
To use this example, you need to customize it according to your setup. First things first, the hosts section needs to be edited. To do that, you need to add your Hyperledger nodes' IPs.
Find Peers and Orderers pods in K8s and make a list of hosts as the following:
<pod name>.<domain name>.svc.cluster.local:<port>Where port is 8443 and 9443 for Orderers and Peers by default.
Edit the instanceid and put the unique identifier handed to you via email.
To create a namespace you can use the following command:
kubectl create namespace <monitoring>Replace monitoring with your desired name.
Import client certtificates:
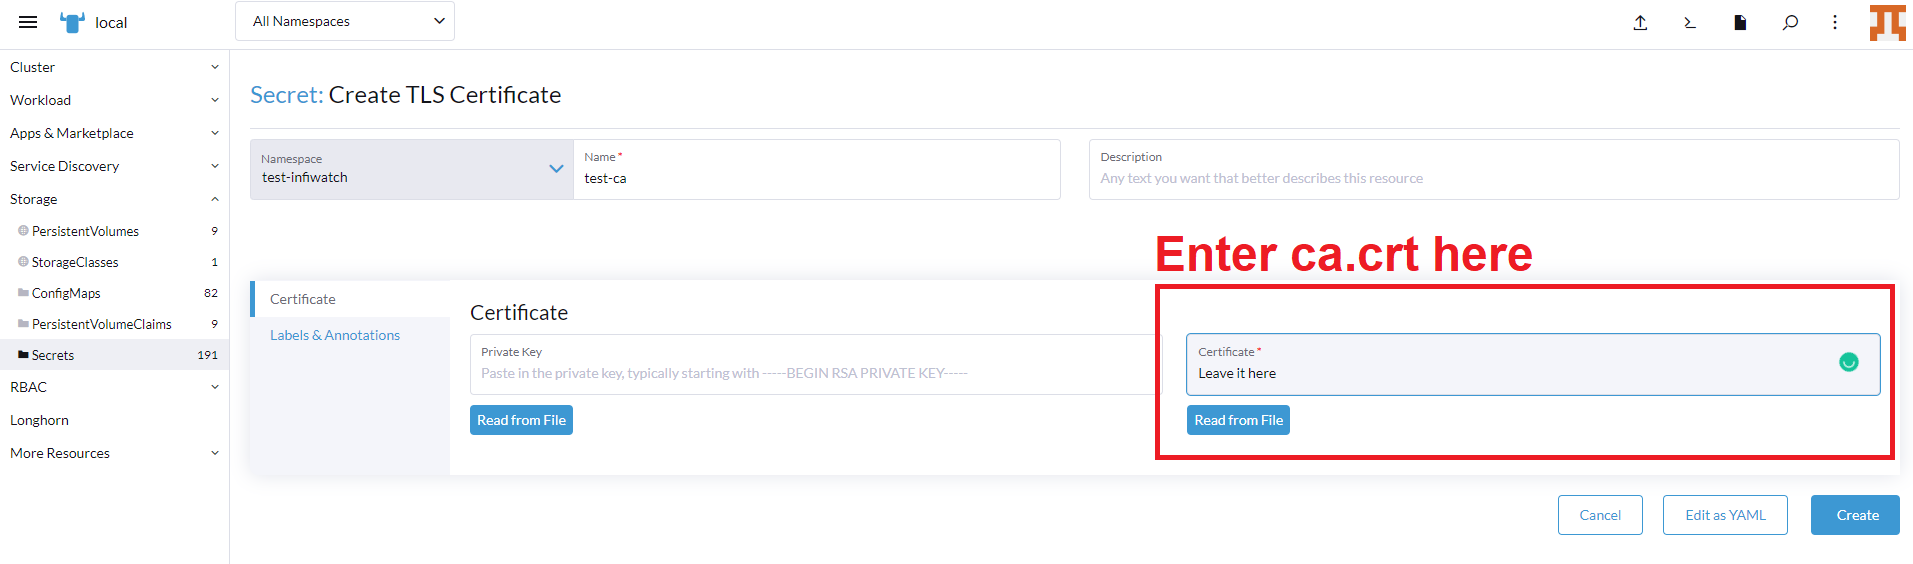
kubectl create secret tls metricbeat-certificate -n <monitoring> --key="client.key" --cert="client.crt"to Import the ca.crt certificate, create a TLS secret in the namespace(e.g., monitoring) manually either by Rancher or Kubectl. Paste the ca.crt's content and leave the private key blank.
To deploy an instance of metricbeat run the following commands.
helm repo add stable https://charts.helm.sh/stable
helm repo add elastic https://helm.elastic.co

helm install --namespace <monitoring> -f <path/to/metricbeat.kubernetes.yml> metricbeat elastic/metricbeat
Make sure metricbeat.kubernetes.yml exists on the host system.
helm upgrade -n monitoring -f <path/to/metricbeat.kubernetes.yml> metricbeat elastic/metricbeatLogin to InfiWatch using your username and password combination and explore your data in pre-built dashboards.