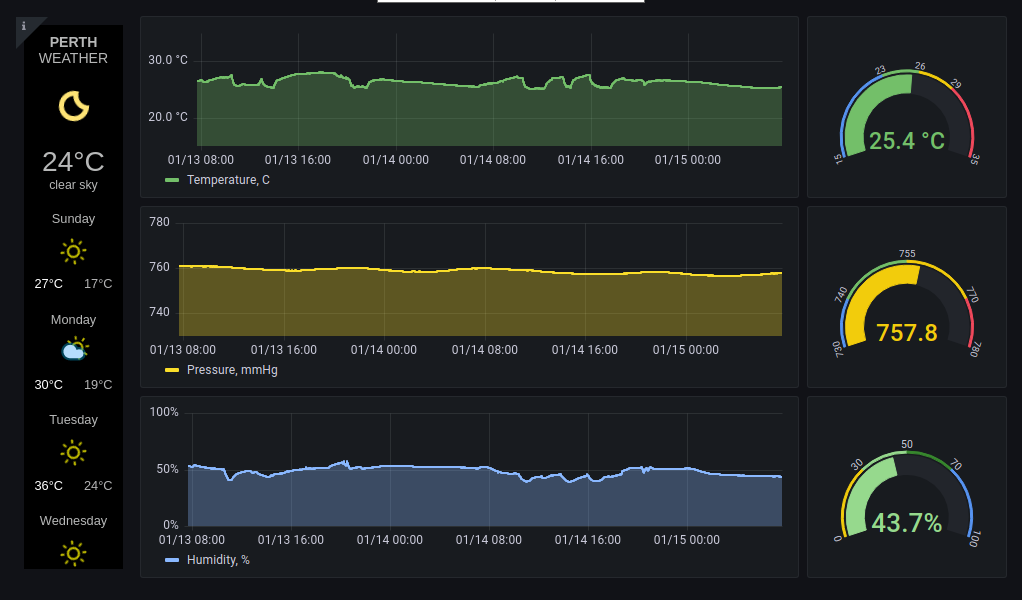
Sensor metrics collection with BME280, storage in PostgreSQL and Grafana dashboard automatically loaded in kiosk mode on Raspberry Pi.
-
Raspberry Pi 4 Model B 4GB RAM https://www.raspberrypi.com/products/raspberry-pi-4-model-b/
-
Waveshare 7" HDMI LCD (C) Capacitive Touchscreen 1024 x 600 https://www.waveshare.com/7inch-hdmi-lcd-c.htm
-
HDMI to HDMI micro cable
-
USB A to USB micro B cable
-
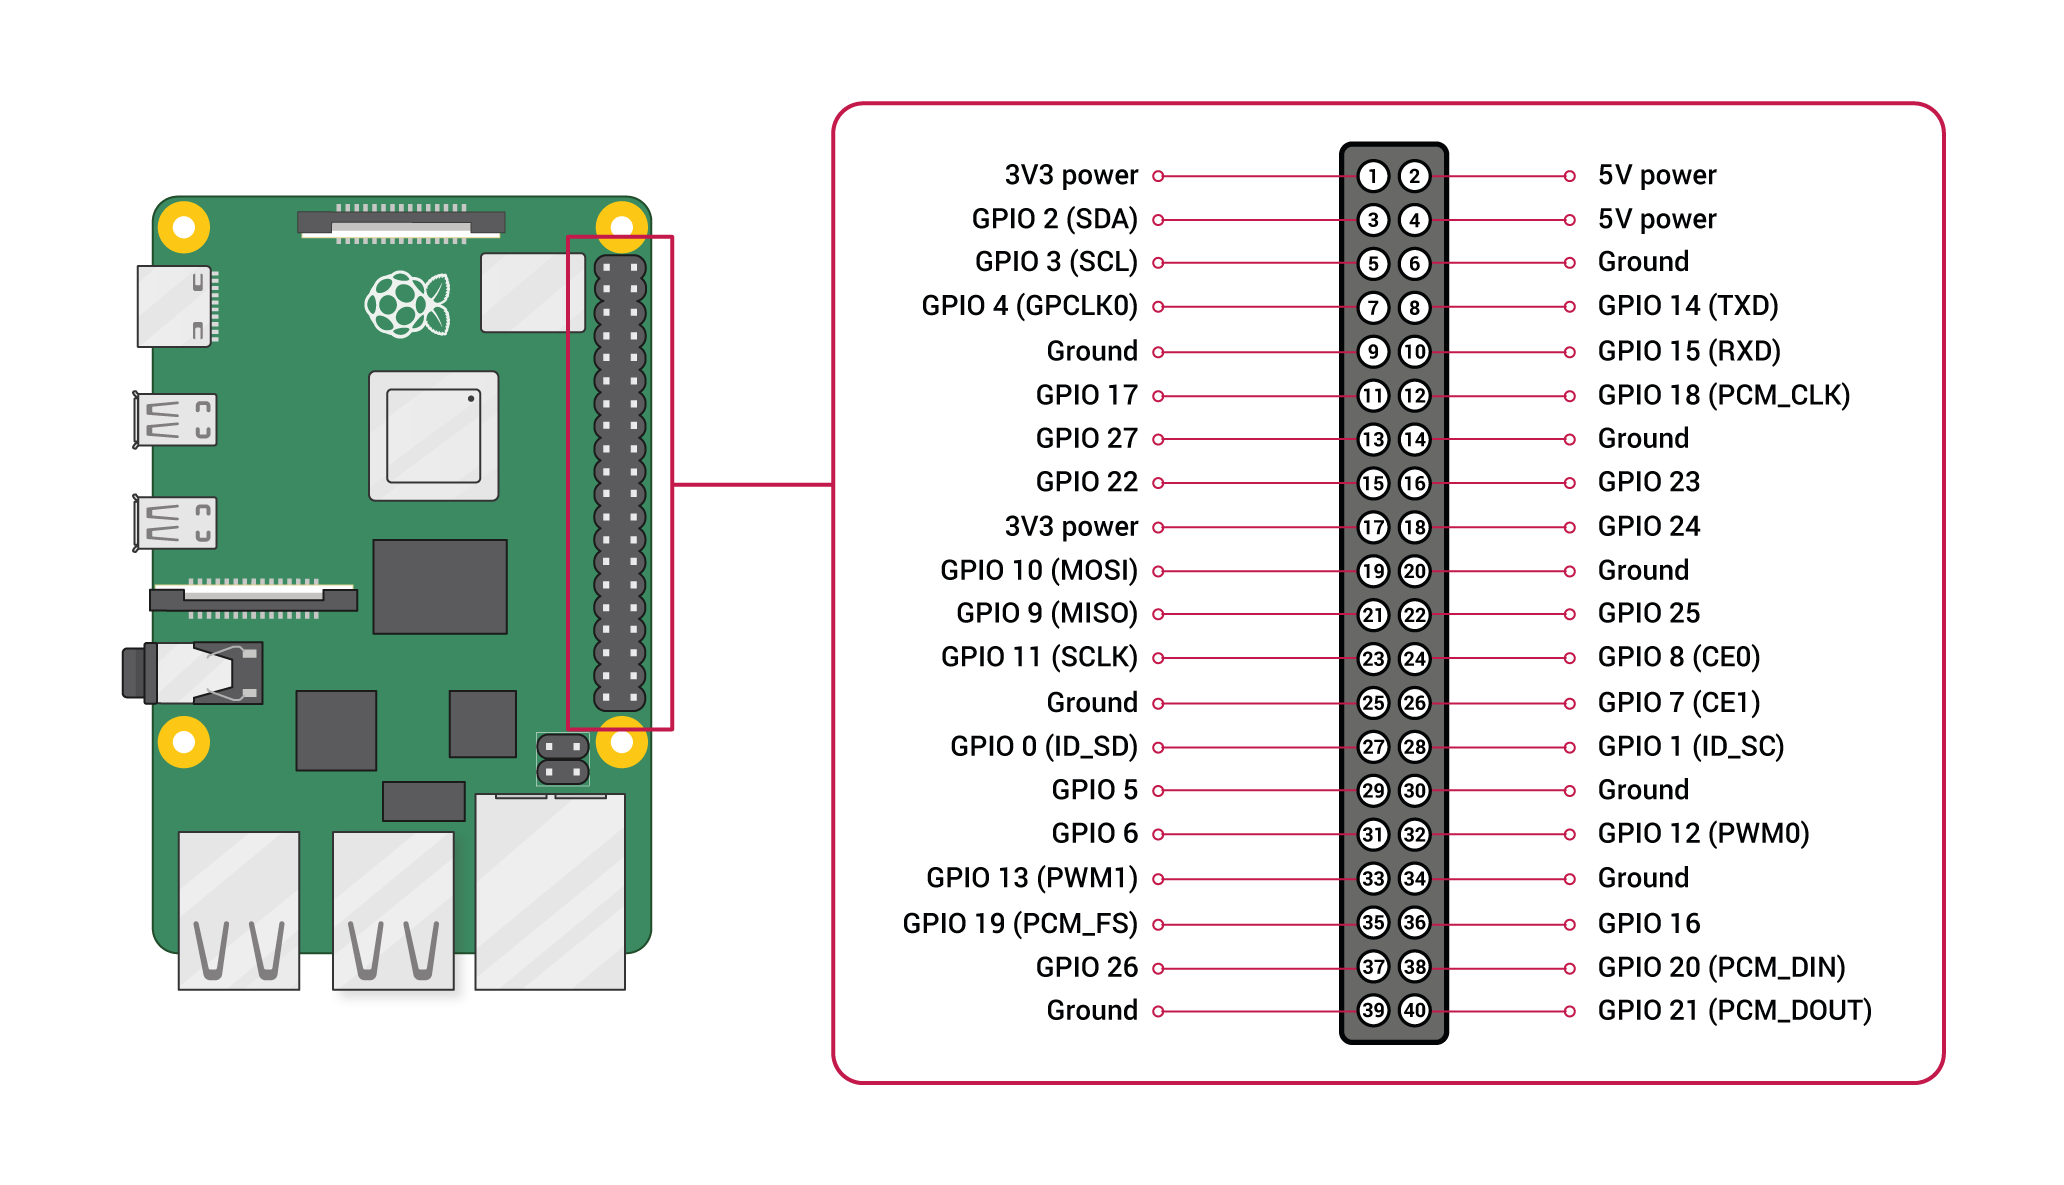
BME280 connection to Raspberry Pi via I2C: 2-6V - 3V3; SDA - GPIO 3 (SDA); SCL - GPIO 5 (SCL); GND - GPIO 9 (Ground).
-
Setup of right-click functionality for Waveshare 7" touch screen https://www.inemov.com/post/set-rightclick-rpi-waveshare7-touchscreen
-
Install PostgreSQL and create pi user and pi database:
sudo apt install postgresql
sudo su postgres
createuser pi -P --interactive
Provide password 'home_monitoring' and allow the pi role to be a superuser. Exit from the postgres user:
Ctrl-q
Table 'home_monitoring' will be created automatically by python script.
- Install Grafana
sudo apt install grafana
Peform following changes in Grafana settings:
cd etc\grafana
sudo nano grafana.ini
Change following parameters:
disable_sanitize_html = true
allow_embedding = true
enable_alpha = false
Exit from editor Ctrl-X and save changes. Restart Grafana service:
sudo systemctl restart grafana-server
If necessary, replace files on Raspberry Pi to match files in the repository etc and usr folders.
- Install python and create virtual environment:
sudo apt install python3
sudo apt-get install python3-venv
python3 -m venv sensor_dev
Activate the virtual environment:
workon sensor_dev
Install necessary libraries:
pip3 install psycopg2
pip3 install smbus2
pip install bme280
- Put scripts in target folder and configure autostart: Copy files from repository \home\pi\home-monitoring to corresponding location on Raspberry Pi.
sudo nano /etc/xdg/lxsession/LXDE-pi/autostart
Add at the end to automatically start three scripts after reboot:
@/home/pi/home-monitoring/sensor2db_activation.sh
@/home/pi/home-monitoring/chromium_start.sh
@/home/pi/home-monitoring/chromium_refresh.sh
- Copy Grafana dashboard Home monitoring-1642299995636.json from the repository and import it in Grafana interface (http://localhost:3000)
login: pi@rpi-homemonitoring password: home_monitoring
name: sensor_dev
user: pi password: home_monitoring database: pi table: home_monitoring host: localhost port: 5432
user: pi password: home_monitoring