Problem: Lack of structured granular data* impedes having a data driven approach to Real Estate investing for individual investors.
Solution: Structure online available data so users can make data-driven decisions in their Real Estate investments.
Approach: Web scraping data from RE directories to find the obtain:
- Predicted profitabilities for listed properties
- Scarcity of properties for rent So investors can decide where to invest and which kind of properties to look for.
We have two different types of data:
- Properties data
- Geographical data
In this project we scrape website data from a relevant spanish Real Estate directory. We get data from properties listed for rent and for sale.
- For rent data: we will use it to train a model that predicts rent prices.
- For sale data: we will predict the rent price for properties for sale to then calculate the predicted profitabilities.
Categoricals:
- neighborhood (self explanatory) -- Only to be used in the model for big cities, more info in the model section.
- geo_town: city or town
- province (self explanatory)
- ccaa: Autonomous Community (simmilar to a state).
- floor: which floor the property is located in.
- lift: (yes or no)
Numericals:
- m2: sqm of each property.
- hood_price_m2: average sqm price for the neighborhood where each property is located.
- n_bath: # of bathrooms each property has.
- n_rooms: # of rooms each property has.
- last_update: # of days since the listing was last updated.
Target variable: rent price.
Properties are extracted from the RE website. Not all properties have all the features that the model is trained on, so the dataset size is sacrified for the sake of improving the information we have about each property. Properties with insufficient information are excluded from the dataset which trains the model.
Also, a feature is generated to improve our model: 'hood_price_m2'. We calculate the average price per sqm for each neighborhood, a feature which will help us predict rent prices.
The data cleaning of the data we work with includes:
- Filtering out towns in which there are less than 10 listed properties.
- Replacing nulls if possible or droping rows with null values if they are not replaceable.
- Converting object columns to numericals for those cases in which the import reads values as dtypes other than ints.
To get accurate geographical data we combine information from CCAA, provinces and towns gathered from the spanish statistics national institute, INE (https://www.ine.es/daco/daco42/codmun/cod_ccaa_provincia.htm).
Then, we merge it with the towns that have properties listed in the RE website and we will use it for the web scraping.
Since we have a very inbalanced dataset when it comes to the # of properties each town has, the best solution is to work with two models, each with its respective dataset:
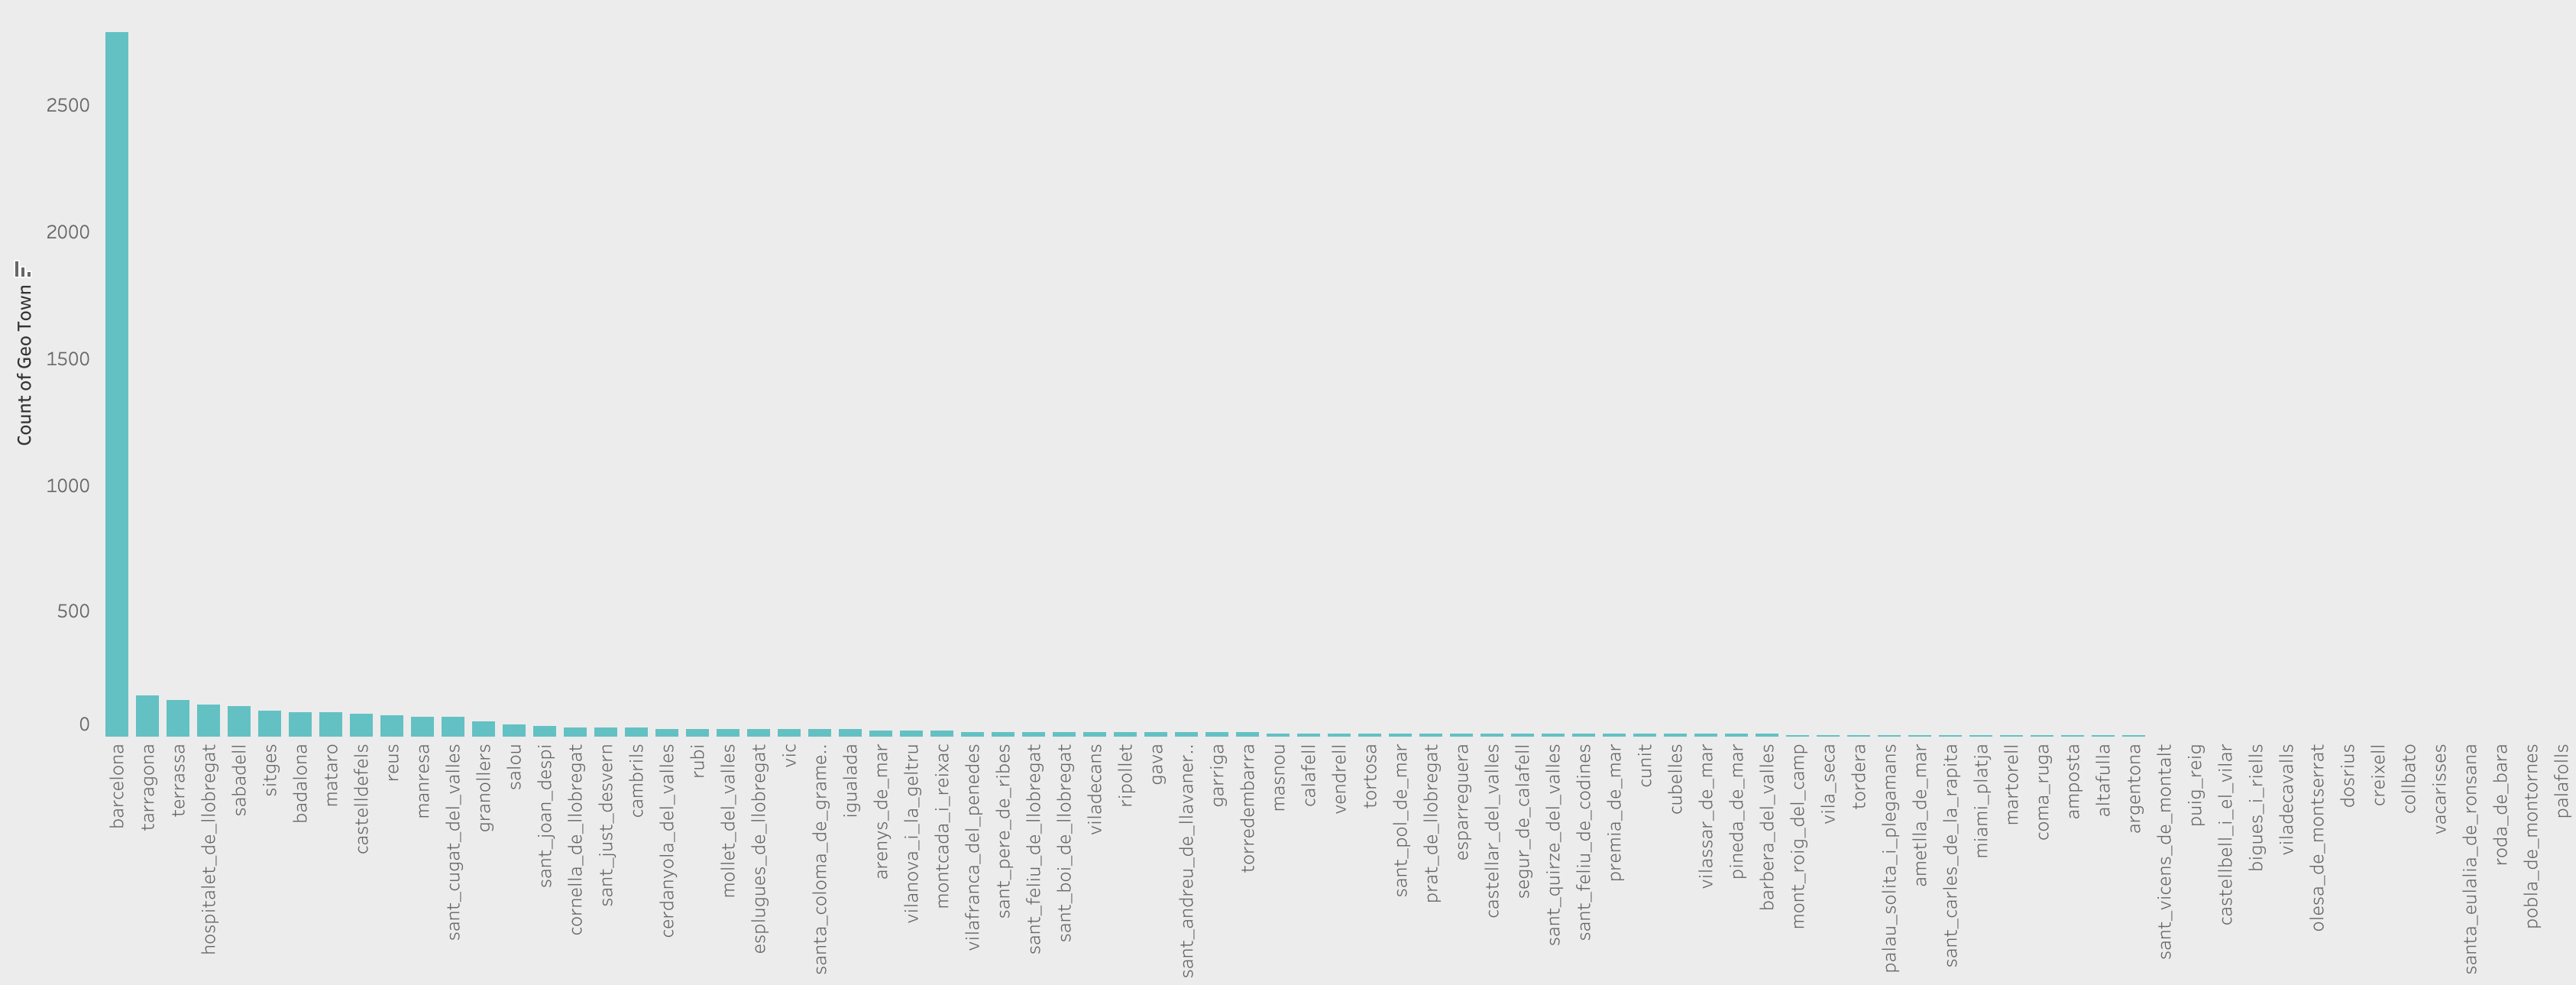
- Model for big cities: filter: city that has > 50% of the properties of the dataset.
- Model for small cities
- Removing outliers to numerical columns. We haven't done it before because we want to remove the outliers of small and big cities' datasets separately.
- Encoding categoricals: So we can fit the data into the models.
- Normalizing numericals: To improve the model performance.
Algorithms used in this model:
- LinearRegression()
- RandomForestRegressor()
Combined with GridSearchCV to find the best possible models, which delivers the following results:
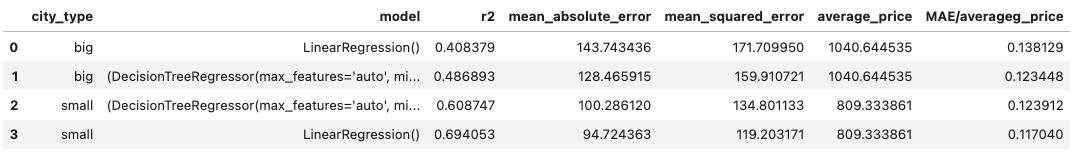
Which can be visualized so we further understand what's going on behind the scenes:
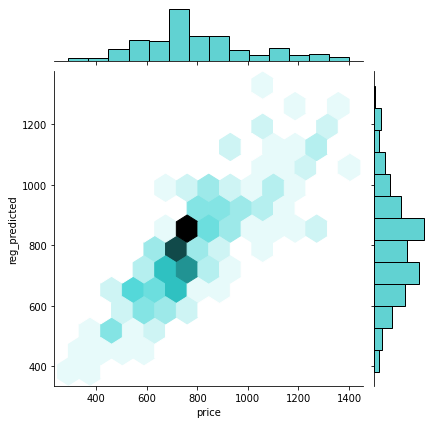
Small cities' best model (LinearRegression()):
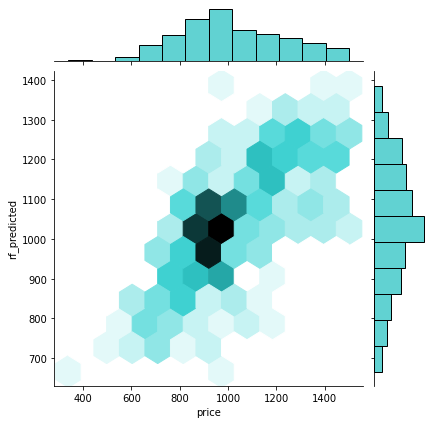
Big cities' best model (RandomForestRegressor()):
First of all, let's take a look at the correlations:
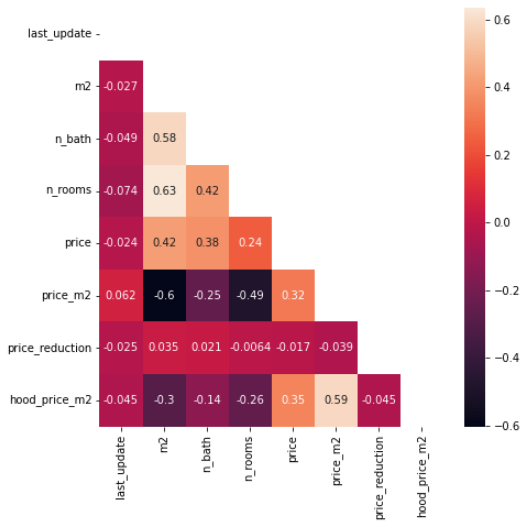
We don't see any features whith excessive correlation so we are good to keep all our features.
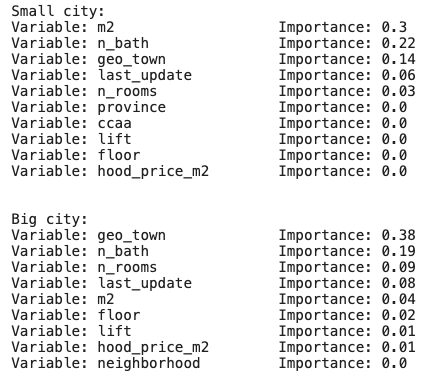
When it comes to the most relevant data, according to our regressor models we have the following importances:
Now that we have the models, we need tu fit them to the dataset of properties for sale so as to predict the rent prices of properties listed for sale and then calculate their profitabilities.
When we try to fit the dataset of properties for sale to the model after cleaning it and encoding it we come up with an error: the shape that the model requires != the shape of the dataset of properties for sale. Why? Because the number of distinct categorical values in both dataframes (properties for rent and for sale) is different; therefore, when we encode them, we get dfs with different shapes.
The solution I've come up with is to merge the dataset of properties for sale and for rent, cleaning it, encoding it and then slicing it. This way we get the two dfs but with the same amount of columns. To test if this is a good procedure, the results of the model for the prediction of rent prices is the same in both cases, if we merge both dfs or if we don't, as done in step 2.
After having predicted the rent price for each property listed for sale, we apply the following formula so as to get the gross ROI that each property would have annually:
ROI = (Prediction * 12) / Price Prediction: predicted monthly rent price by the best performing model. Price: Price of sale which the property is listed at.
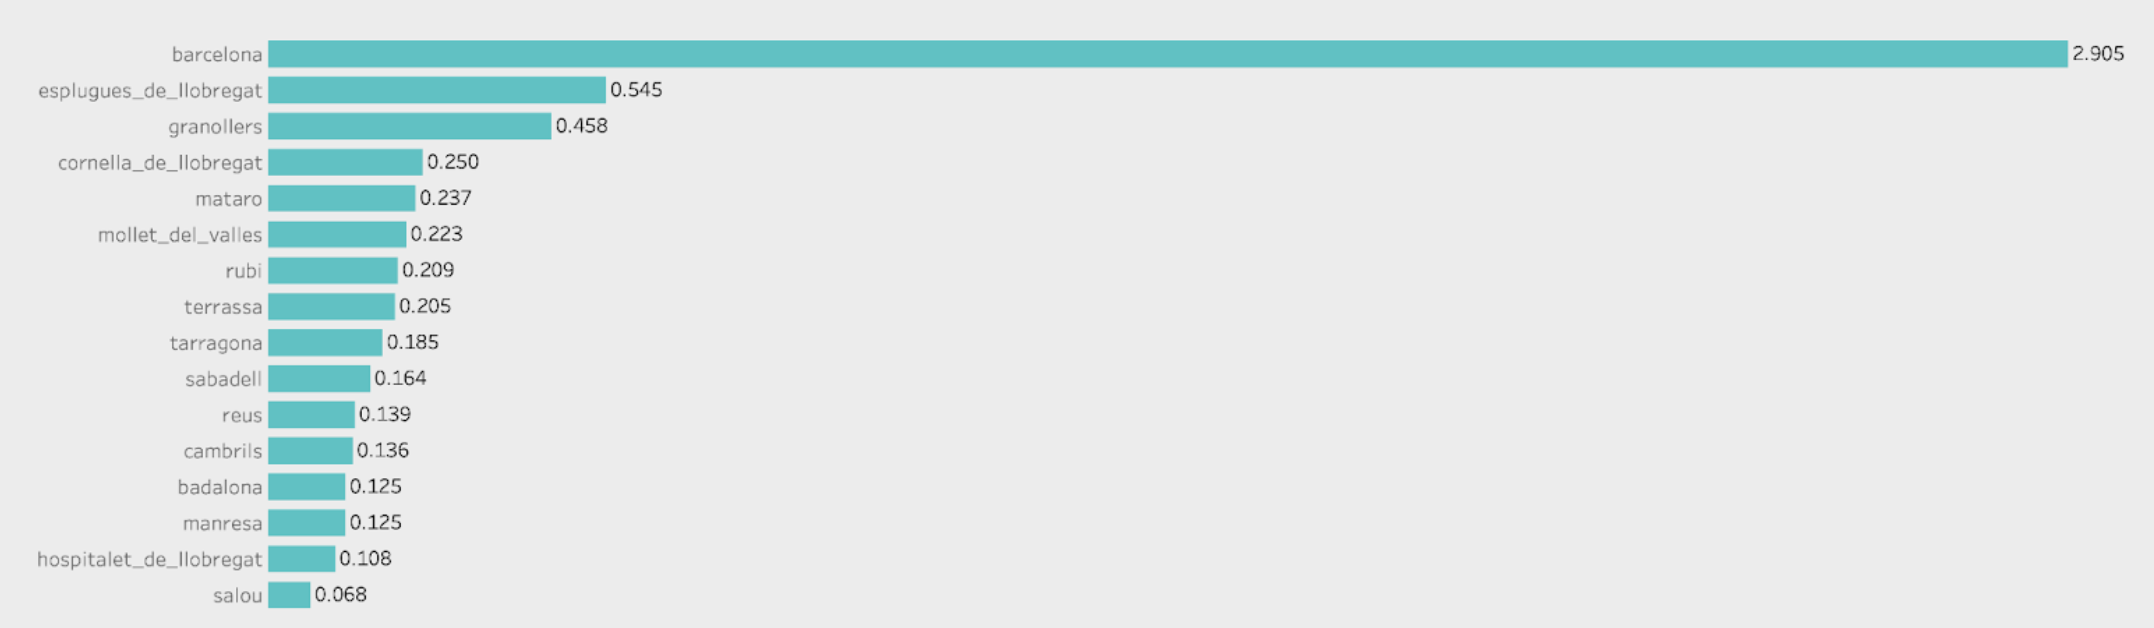
Another relevant aspect to be considered when investing is whether if the town in which you are going to buy a property has many properties for rent or not. It will give you negotiation power when renting your property thus improve your ROI.
To get this information we claculate the # of propertes for rent and for sale in each town or city and we calculate the following ratio: Rent density = # Properties for rent / # Properties for sale
The lower the ratio, the more scarcity there is for properties for rent and better ROI you will be able to obtain.
From the results of the predictions, we can conclude:
- The accuracy of the model is good enough to make predictions with an average error we can tolerate.
- Properties under 75k in small cities with a low density ratio are likely to be the most profitable ones.
As next steps, I want to:
- Analyze correlations between predicted profitabilities and the rent density ratio.
- Make the model more user friendly via streamlit.
- Gather more features for each property to improve the models.
- Add Google Search trends data to detect towns with raising popularity.