.
└── mini_comp/
    ├── data/
    │   ├── preprocessed data/
    │   │   ├── dengue_features_test.csv
    │   │   ├── dengue_features_train.csv
    │   │   └── dengue_labels_train.csv
    │   └── Dengue_data_description.txt
    ├── figures/
    │   ├── Iquitos: Gradient Boosting Classifier.png
    │   ├── Iquitos: Random Forest.png
    │   ├── Iquitos: SVR.png
    │   ├── San Juan: Gradient Boosting Classifier.png
    │   ├── San Juan: Random Forest.png
    │   └── San Juan: SVR.png
    ├── results/
    │   ├── iq_All_lagged_and_mm_gb.csv
    │   ├── iq_All_lagged_and_mm_rf.csv
    │   ├── iq_All_lagged_and_mm_svr.csv
    │   ├── sj_All_lagged_and_mm_gb.csv
    │   ├── sj_All_lagged_and_mm_rf.csv
    │   └── sj_All_lagged_and_mm_svr.csv
    ├── README.md
    ├── my_preproc.ipynb
    ├── pipeline_v1.py
    ├── preproc.py
    └── requirements.txt
This GitHub repository contains the code and resources for the DengAI: Predicting Disease Spread challenge, hosted by DataDriven (https://www.drivendata.org/competitions/44/dengai-predicting-disease-spread/). The challenge aimed to address the problem of predicting the number of dengue fever cases in a given region. Dengue fever is a mosquito-borne viral disease that affects millions of people worldwide, especially in tropical and subtropical regions.
Accurate predictions of dengue fever cases can help authorities and healthcare professionals take proactive measures to prevent the spread of the disease, allocate resources efficiently, and plan appropriate responses. Machine learning techniques provide a powerful approach to analyse historical data and make predictions about future outbreaks.
The primary objective of the DengAI Challenge was to develop a predictive model that could forecast the number of dengue fever cases in both San Juan, Puerto Rico and Iquitos, Peru. We were provided with historical data, such as weather information, geographical locations, and previous dengue case records, to train their models.
The challenge aimed to foster innovation in the field of ML and contribute to the ongoing efforts to combat dengue fever by providing accurate predictions. By predicting the number of cases in advance, public health officials could take appropriate preventative measures, educate the public, and allocate resources efficiently.
To tackle the challenge, we implemented a pipeline-based approach that involved several steps. The following is an overview of our methodology:
Data preprocessing: To ensure high-quality inputs for our ML models, we performed data preprocessing tasks, including data cleaning, handling missing values, and feature engineering.
Feature selection: We carefully selected the most relevant features that could contribute to accurate predictions, considering their correlation with dengue fever cases.
Handling missing values: To counteract gaps in the data, we used interpolation to predict a value based on the next valid observation.
Normalisation: As part of the data preparation process, we applied the min/max normalisation technique to standardise the features and bring them to a similar scale. This step ensured that no particular feature dominated the learning process.
Adding lag to features: Following research, we added a lag of two weeks to account for the incubation period of humans.
Creating interaction feature: After exploring the data, it became clear that there was a relationship between humidity, temperature and case numbers. We found that above 42% humidity and 24 degrees celsius is when mosquitos thrive. Data was then categorised as either meeting this criteria (1), or not (0).
Model training: We experimented with various classifiers, such as decision trees, random forests, and support vector machines (SVM), to identify the best-performing model. We trained these models using the preprocessed and normalised data.
Grid search: We conducted a grid search to extract the best parameters, depending on the training data, that we split further into train and test.
Model evaluation: We evaluated the performance of each model using appropriate evaluation metrics, in our case the mean squared error (MSE), to assess their predictive capabilities.
Prediction: Once we selected the best model based on its performance, we used it to make predictions on future case numbers.
Here are figures highlighting our predictions for each location.
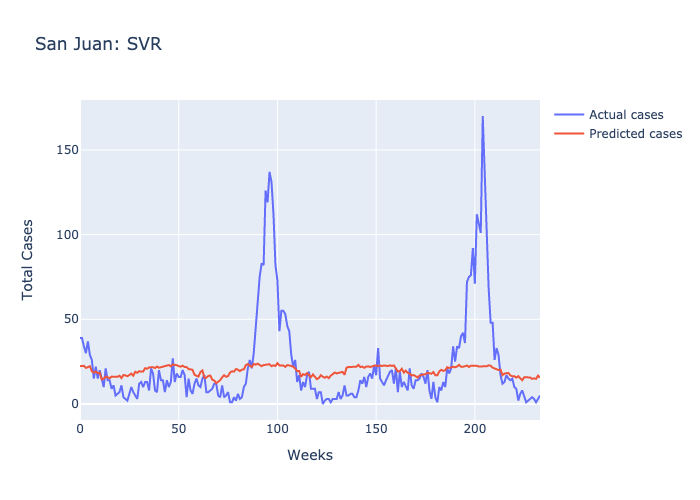
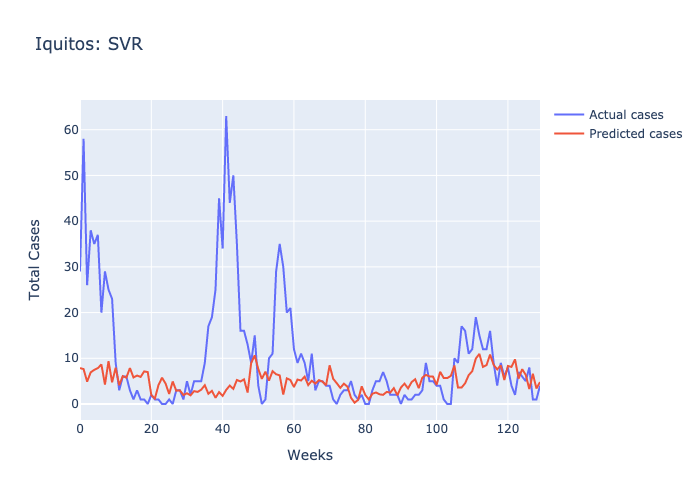
Parameters: For SJ we used 1/the number of features and the default scale of features for IQ.
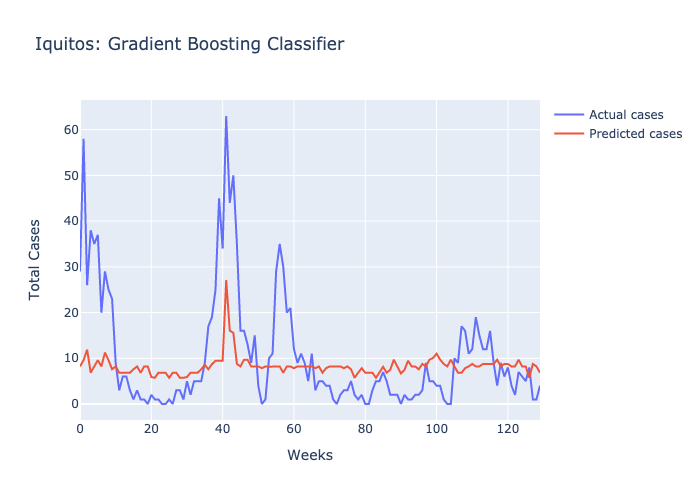
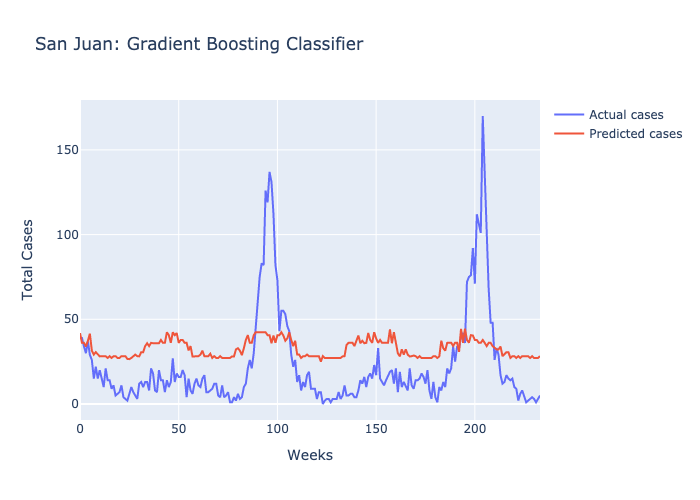
Parameters: The maximum number of decisions a tree could make was 3, the total number of features to consider was 0.9 and there were 5 trees.
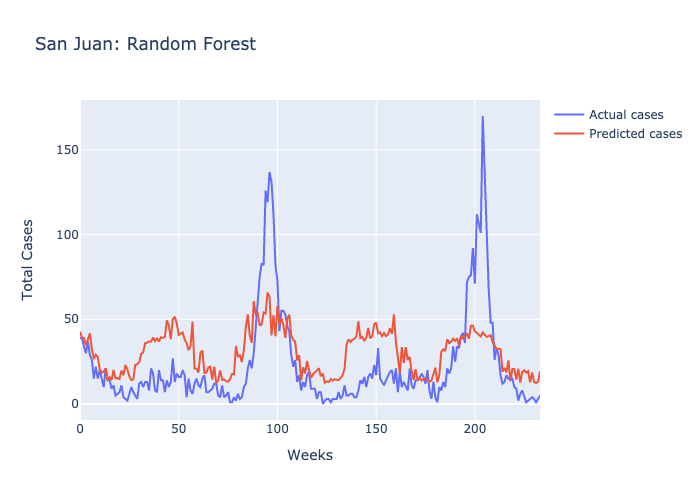
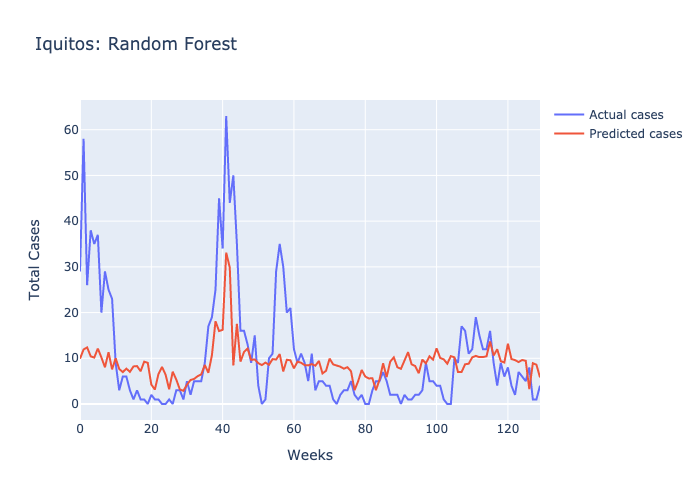
Parameters: The maximum number of decisions a tree could make was 3 and there were 100 trees.
Following our evaluations of each model, it was clear that the Random forest was the best at predicting future case numbers, based on the MSE.
In future, to improve our methods, we could include the feature engineering in the grid search and attept different combinations.