Skip to content

Flask web app to create Sankey diagram from football play-by-play data.

License

Notifications You must be signed in to change notification settings

ewelchman/sankey_app

Folders and files

NameName
Last commit message
Last commit date

Latest commit


History

16 Commits


Repository files navigation

x

Capture game flow at a glance with a sankey diagram

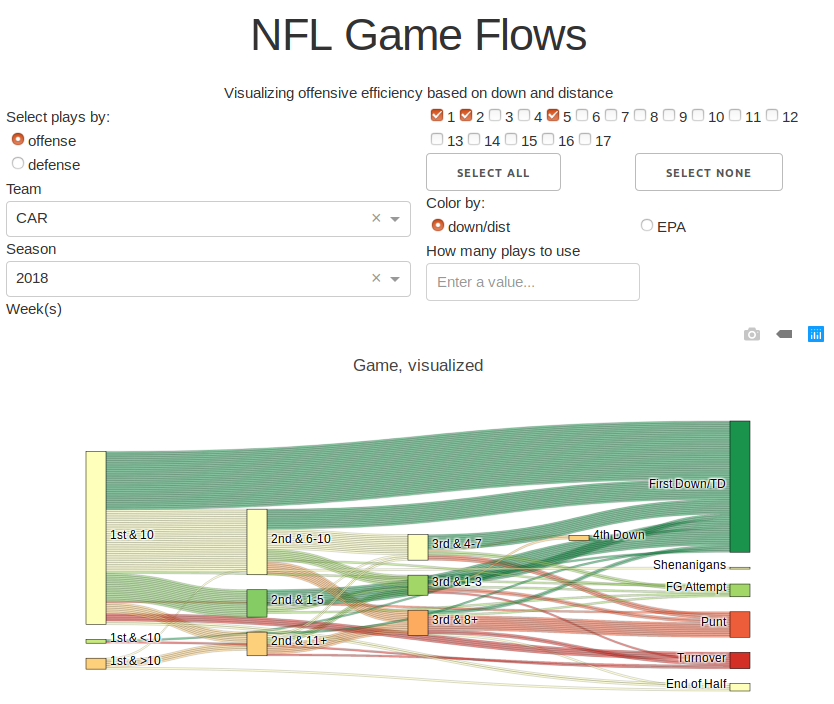
This web app takes raw, detailed play-by-play data scraped from http://pro-football-reference.com and uses plotly to create dynamic illustration of offensive performance. How often does the offense get a first down on 1st and 10. Do they often end up in 2nd/3rd and long situations? Looking at offensive performance with this kind of visual aid can provide an instant and intuitive understanding that can be difficult to illustrate with numbers alone.

About

Flask web app to create Sankey diagram from football play-by-play data.

Resources

License

Stars

Watchers

Forks

Releases

No releases published

Packages

No packages published

Languages