Intro How would you sum up 2020? Is there a song that comes to mind, or an emotion? As the year has evolved, it’s safe to say that 2020 has been a beast in and of itself. However, just like time, everything else has evolved from an outsider standpoint. Is there a chance that music can reflect the way society evolves?
Okay, another rhetorical question. How would you sum up the last ten years of music? Some would say “great,” some might say “bad.” For some, songs connect them to certain times in their lives - certain events, certain feelings during a certain year - and they are encapsulated in time with a song from a certain year.
Let’s face the music.
For our final project in Computational Analysis of Big Data, we decided to analyze popular music over the years and examine what it can tell us about the world. We hoped to answer the following:
How has lyrical sentiment changed over time? Does lyrical sentiment correlate positively or negatively with global events? How has lyrical creativity changed over time? How do popular genres change over time?How has artist demographic changed over time?
We decided to scrape data from Wikipedia and the Billboard Top 100 to bring the pieces of our project together in hopes to answer this myriad of questions. This project did a scraping and data aggregation of the Billboard Top 100 from 1950-2015. The data had a lot of useful attributes for our analysis, including genre labels and sentiment scores. We decided not to expand the data to 2019 because we wanted all of our data to be uniform, and we did not want to make errors in trying to recreate the mentioned project’s data analyzation process.
For data about global events during the same time period, we used two Wikipedia timelines that listed some of the most relevant events for each year (here and here).
Lyrical Sentiment/Creativity: Using the preprocessed Billboard data, visualizing changes in lyrical sentiment, creativity, and popular genres was pretty simple. For sentiment, we created scatter plots for the yearly average of each sentiment category: positive, negative, neutral, and compound. For lyrical creativity, we estimated this by getting the fraction of lines in a song that were repeated. The data we used had two attributes, number of duplicate lines and number of lines. We then made a scatter plot of each year’s average.
Popular Genres: First, we counted all of the genre tags used for each song of each decade and sorted by decade. We then focused on genres that on average made up at least 5% of the Top 100 each decade. Once we had the top genres, we graphed each genre’s representation throughout the decades.
Lyrical Sentiment vs World Events: Using VADER sentiment analysis, we got a overall (compound) sentiment score for the world events of each year. We then graphed this versus the average compound sentiment score for each year. We also graphed yearly song sentiment vs. global event sentiment of the year before. This was to check for a delay in correlation.
*note: Initially, we had planned to label each year’s events as positive or negative, but upon doing sentiment analysis of the events, all of the yearly events were scored overwhelmingly negatively, therefore all years would have been label as negative. To overcome this, we decided to only compare compound scores between songs and events.
Artist Demographic: We started our demographic analysis by trying to find data on artists’ ethnic (nationality is not specific enough for obvious reasons) background. This is very poorly documented and we could not find any source with consistent data. We then tried to scrape pictures of each artist from Wikipedia and Google Images. We then ran images through this skin color detection program to get an average skin color. We would then score the skin colors on a light to dark spectrum to try and see how complexion changed over time. Unfortunately, it was difficult to make a program that could correctly scrape a photo that would be appropriate for the skin color detection program, and we did not have the time or resources to collect the data by hand.
Below are the graphs for top positive, neural, negative, and compound sentiment in songs over time.
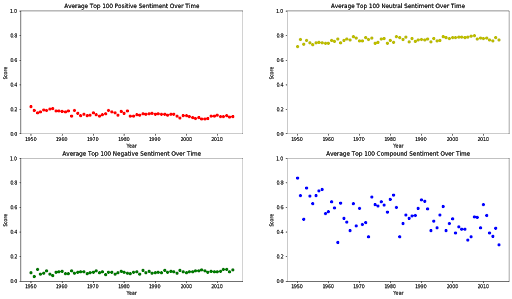
Lyrical Sentiment: As you can see, over time the compound sentiment of songs has had a downward trend, moving towards more negative sentiment. There’s quite a big difference between some of the songs in the middle of the 20th century versus just 50 years later. Who does this reflect on? The people consuming the music or the ones producing it? Are humans more sad as a global population, or is art moving in a direction that is more negative? One could argue both, as many think of art as a reflection of the world.
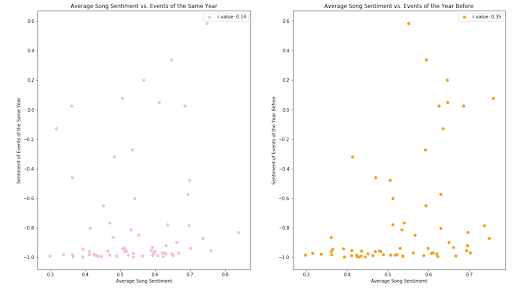
Lyrical Sentiment vs Global Events: When comparing lyrical sentiment to global events, we found very low correlation, even when offsetting the timelines by a year. It was interesting to see that the offset comparison did have a correlation double the magnitude of the initial comparison. It could be a coincidence, but looking at a larger set of data might provide some clarity!
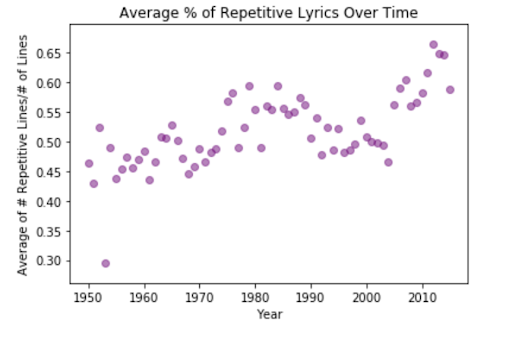
Creativity: We then looked at the creativity of songs, particularly at repetitive lyrics and lines within genres. This, then, highlights ideas of originality, what’s popular, and what’s trending. As time has gone on, we can see that the average percentage of repetition in songs has definitely gone up in the positive direction. This is likely because catchphrases and choruses have gained popularity. In recent times, most people know songs through the premise of the chorus, and money grabs in the industry pretty much mandate original, catchy, short choruses in order to make it onto the Billboard Top 100. Many modern day sociological theorists suggest that the repetition of certain phrases and chorus increase an artist’s “recognizableness” and can define an artist - hence, the more recognizable, the more revenue. Music these days has also shifted towards at-home artists rather than mainstream recording studios. Ever notice how you’ll remember a chorus of a song from the last 10-15 years or so off the top of your head better than the chorus of a song you might remember your parents singing to growing up from their “good old days?” Might we remind you all of 1. ‘Gucci Gang’, 2. Anything featuring DJ Khaled, 3. Literally every song on TikTok as incredible examples of this very phenomenon.
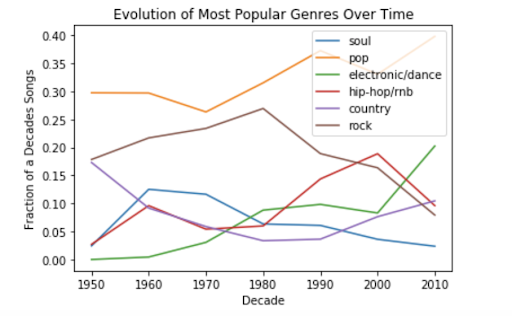
Genre Evolution: We also looked at music by genres to see if some are truly “timeless” - that is, consistent, popular, and dominant within the music industry. We found that alternative/indie music has increased in popularity, after surging in the 2000s; this is likely a direct reflection upon the new wave of independent artists; Electronic/dance music made lots of headway during the 2000’s (anybody wanna dance… feel the heat with somebody?) as did pop. This is definitely evident in real life - we bet you could name five songs from The Chainsmokers and Calvin Harris. Hip-hop and r&b were on the rise from the 80s to the beginning of the new century (think Eminem, Tupac, Biggie and the tones they set for hip-hop and r&b post-initial introduction of spoken word, rap, and hip-hop during the Jim Crow era). Country music has dipped in popularity since the 60’s but might be on the comeback? (Thanks T-Swift.)
So… what are some takeaways? Music is less original. Songs are more negative in sentiment. Redundant choruses and repetition run rampant - but this isn’t new or revolutionary. Popular genres peak and wane, some come back at full force. It’s still unclear how much global events affect popular music. Demographics are still difficult, but it’s time we rightfully acknowledge the history that ties into the way music is perceived.
Moving forward, it would be great to do a demographic analysis on the top artists - that alone could tell a lot about the connection between world events/perceptions and music. Also, another try at our global events analysis could be fruitful. With more complete data on both the music and event sides, patterns would definitely start to emerge.
Special thanks to the previously mentioned GitHub repositories, Lucian Leahu, and DIS Copenhagen.