I'll learn statistics and R in this program, which are two critical abilities for my success in the data sector. Data analytics is built on statistics. All the way to complicated deterministic models, starting with summary statistics like mean, median, and mode.
We contextualize our facts with the aid of statistics. When it comes to making well-informed judgments, statistics plays a crucial part in everything from product creation to sports betting, stock market research, and movie production. In the business environment, statisticians frequently serve as the company's go-to individuals for problem-solving, resource planning, and decision-making.
I will go through summary statistics and regression models in this session before moving on to more complex statistical models and measurements that are frequently used in data analytics.
The ability to construct statistical research and understand study findings will allow me to tackle increasingly complex challenges involving data engineering. I'll spend some time in this lesson learning how to utilize the computer language R in order to better understand these statistical ideas.
Data management, statistical analysis, and visualization were all made more comfortable by R. R has established itself as one of the most widely used tools for data analysis and reporting among the community of data scientists throughout time. Numerous firms, from tiny family enterprises to the biggest Fortune 500 companies like Google, Ford, and Coca-Cola, employ R. The majority of job postings for data science and data engineering clearly include R competence as either a necessary or highly desirable ability.
I will go through the fundamentals of R in this lesson, including how to read datasets, manipulate data, do computations, and visualize data using a variety of 2D plots.
I'll also execute all of my statistical tests and analyses using R. I'll be able to create my own R scripts at the conclusion of this module so that I can fully analyze any dataset.
- For the past ten years, Jeremy has been with AutosRUs. He's seen a lot of automobiles come and go in his time, and the corporation is now understanding that their decision-making process should be modernized.
- Jeremy was chosen as the principal analyst for the company's data analytics team because of his strong internal contacts and extensive understanding of the product. The data analytics team is responsible for retrospective data analysis, analytical verification and validation of existing vehicle requirements, and study design for future product testing.
- The AutosRUs leadership team understands that the most successful automotive launches use data analytics into every choice. To keep senior management satisfied, Jeremy must guarantee that his studies have a statistical backbone, a quantifiable meter, and a clear interpretation of the results.
- Furthermore, the AutosRUs data team is made up of five people who only know how to program in R, so Jeremy will have to learn a new language in order to run those statistical tests.
- I will assist Jeremy with statistical tests using the R programming language in this module. Summary statistics for various variables, visualizations for various datasets, and your interpretation of statistical test findings will all be required. In order to improve AutosRUs manufacturing process, I will also need to apply my critical thinking abilities to suggest my own research design, hypothesis, and analytic workflow.
- Which variables/coefficients provided a non-random amount of variance to the mpg values in the dataset?
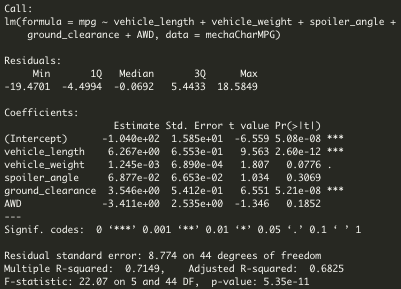
Multiple R-Squared cofficient determines the amount of non-random variance that the model is able to predict. In contrast, each Pr(>|t|) value represents the probability that each coefficient contributes a random amount of variance to the linear model.
- Is the slope of the linear model considered to be zero? Why or why not?
As seen on column "Estimate" of Image 1. Statistical Summary of the Linear Regression Model With the Intended P-Valuee, slope of linear model is not considered to be zero. There is significant linear relationship as each dependent value would not be determined by random chance and error. Therefore, our linear model would not be a flat line with a slope different than 0. Which means, null hypothesis is rejected and alternative hypothesis is accepted.
- Does this linear model predict mpg of MechaCar prototypes effectively? Why or why not?
First, we would have to define what "effectively" means in this case. As mentioned during the module, effectively would mean 99% (or higher) for a drug test or maybe around 70% for data related to social studies experiments. In this case, the p-value of our linear regression analysis is 5.35 x 10⁻¹¹, which is much smaller than our assumed significance level of 0.05%. Therefore, we can state that there is sufficient evidence to reject our null hypothesis, which means that the slope of our linear model is not zero. Also, our R-Squared cofficient is 0.7149, which means indepent variables explain 71.49% of depentent's variable variance.
Image 1. Statistical Summary of the Linear Regression Model With the Intended P-Values
The design specifications for the MechaCar suspension coils dictate that the variance of the suspension coils must not exceed 100 pounds per square inch. Does the current manufacturing data meet this design specification for all manufacturing lots in total and each lot individually? Why or why not?
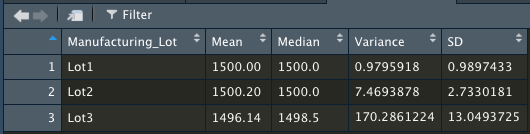
- Total variance considering 3 lots is 62.29356 pounds per square inch. Nevertheless, zooming into each individual lot, we can see that lot 3 has a considerable higher ammount of variance in relation to lots 1 and 2, which drives up total variance higher. Lot 3 does not meet the criteria of a maximum variance of 100 pounds per square inch as it has 170.2861224, which means pieces have higher manufacturing differences between each other for this lot (lot is less homogeneous).
Image 2. Total Summary Dataframe That Has the Mean, Median, Variance, and Standard Deviation of the PSI for All Manufacturing Lots

Image 3. Lot Summary Dataframe That Has the Mean, Median, Variance, and Standard Deviation for Each Manufacturing Lot
Briefly summarize your interpretation and findings for the t-test results. Include screenshots of the t-test to support your summary:
- As seen on Image 4. T-Test That Compares All Manufacturing Lots Against Mean PSI of the Population, considering a mean PSI of the total population of 1,500 fot the three manufacturing lots, there is no statistically significant difference between the population's mean and sample's mean. Therefore null hypothesis is accepted.
- Zooming into each individual lot, results are as follows:
- Lot 1: As seen on Image 5. P-value is 1, higher than 0.05 significance level, meaning that there is no statistically significant difference between sample's mean and population's mean. Null hypothesis is accepted.
- Lot 2: As seen on Image 6. P-value is 0.6072, higher than 0.05 significance level, meaning that there is no statistically significant difference between sample's mean and population's mean. Null hypothesis is accepted.
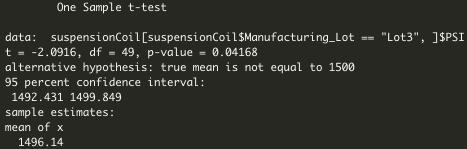
- Lot 3: As seen on Image 7. P-value is 0.04168, lower than 0.05 significance level, meaning that there is a statistically significant difference between sample's mean and population's mean. Null hypothesis is rejected and alternative hypothesis is accepted.
Image 4. T-Test That Compares All Manufacturing Lots Against Mean PSI of the Population
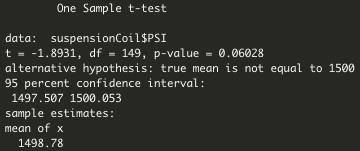
Image 5. Lot 1 T-Test That Compares Each Manufacturing Lot Against Mean PSI of the Population**
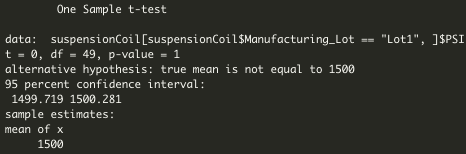
Image 6. Lot 2 T-Test That Compares Each Manufacturing Lot Against Mean PSI of the Population
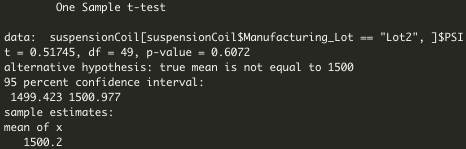
Image 7. Lot 3 T-Test That Compares Each Manufacturing Lot Against Mean PSI of the Population
Write a short description of a statistical study that can quantify how the MechaCar performs against the competition. In your study design, think critically about what metrics would be of interest to a consumer: for a few examples, cost, city or highway fuel efficiency, horse power, maintenance cost, or safety rating.
Address the following questions:
- What metric or metrics are you going to test?
- Safety Feature Rating: Independent Variable
- Drive Package : Independent Variable
- Engine (Electric, Hybrid, Gasoline / Conventional): Independent Variable
- Resale Value: Independent Variable
- Average Annual Cost of ownership (Maintenance): Independent Variable
- MPG (Gasoline Efficiency): Independent Variable
- Current Price (Selling): Dependent Variable
- Hypothesis: Null and Alternative
- What is the null hypothesis or alternative hypothesis?
- Null Hypothesis (Ho): MechaCar is priced correctly based on its performance of key factors for its genre.
- Alternative Hypothesis (Ha): MechaCar is NOT priced correctly based on performance of key factors for its genre.
- What statistical test would you use to test the hypothesis? And why?
- Multiple linear regression would be used to determine the factors that have the highest correlation/predictability with the list selling price (dependent variable), i.e., which combination has the greatest impact on price.
- What data is needed to run the statistical test?
- Data for comparable models across all major manufacturers for past 3 years.