Unsupervised machine learning is the topic of this module. We utilize unsupervised learning instead of supervised machine learning since the result is unknown. To find patterns or groupings in data, unsupervised machine learning is utilized instead.
A bank, for example, may utilize client segmentation to tailor credit cards to certain demographics. They might categorize potential cardholders based on their age, location, or gender. They might target millennials and baby boomers, for example. They might also utilize marital status or economic level.
Unsupervised learning does this by relying just on input data. There isn't any information about the output. As a result, I woll start with data processing so that we may apply an unsupervised model. Then, using clustering and the well-known K-means technique, we will group data together. Finally, we'll use principal component analysis to improve the efficiency of our models.
- Martha, my childhood closest friend, and I fantasized about transforming the world all the time. So she jumps at the chance to propose a cryptocurrency investment to her employer, Accountability Accounting. After all, you and I both believe that cryptocurrency's purpose is to change the world.
- As Martha and I both know, bitcoin's popularity has resulted in a price increase that has made it unaffordable for many new investors. However, there are a plethora of other cryptocurrencies accessible at lower prices.
- Martha has a cryptocurrency data set that she may examine in any way she sees fit. My mission is to assist Martha in identifying patterns that will persuade her company to invest in these new currencies. This task is ideal for unsupervised Machine Learning, which is fortunate for both of you and Martha's business.
- Create a report that includes what cryptocurrencies are on the trading market and how they could be grouped to create a classification system for this new investment using Machine Learning clustering algorithms
Image 1. Elbow curve using hvPlot to find the best value for K
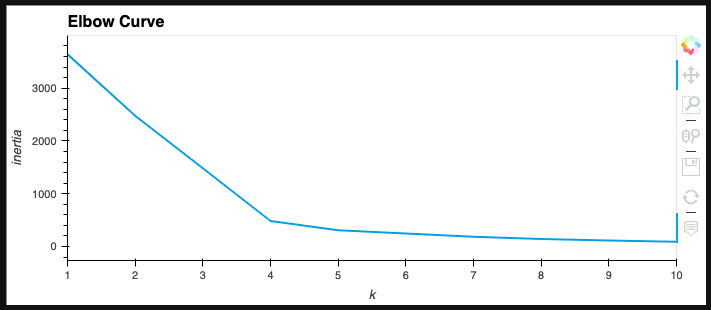
Image 2. Table with tradable cryptocurrencies using the hvplot.table() function
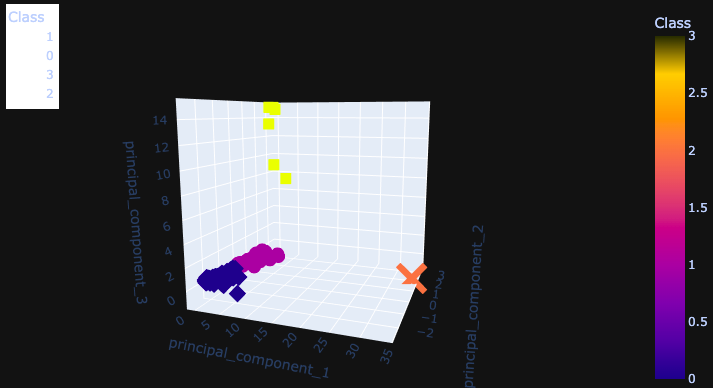
Image 3. 3D scatter plot using the Plotly Express scatter_3d() function to plot the three clusters from the clustered_df DataFrame
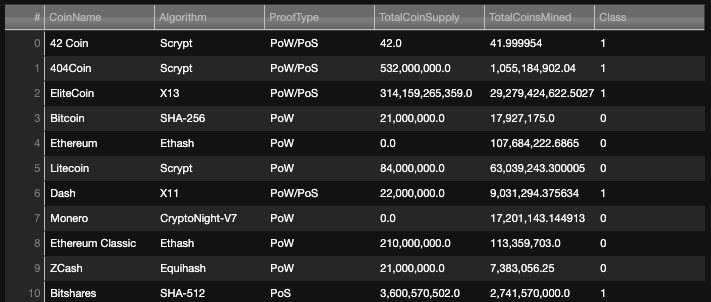
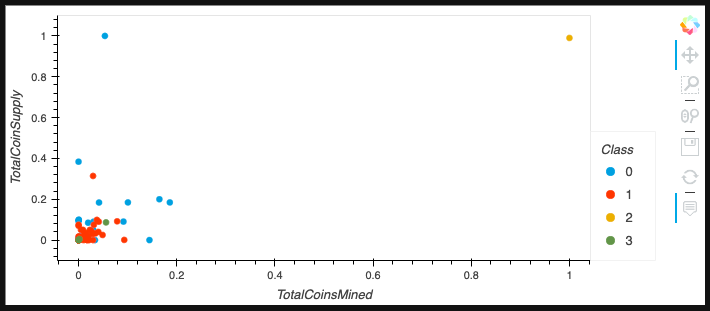
Image 4. hvplot scatter plot with x="TotalCoinsMined", y="TotalCoinSupply", and by="Class", showing the CoinName when you hover over the the data point