This example complements the blog post "A full stack in one command", providing the docker compose files responsible for deploying an example architecture of the Elastic Stack.
This architecture utilises Beat modules for data sources, populating a wide range of dashboards to provide a simple experience for new users to the Elastic Stack.
-
Docker-Compose >= 1.13.0
-
Docker for Windows (Linux mode) Windows 10, 2012. Docker version >= v17.06.0
-
Docker for OSX. Docker version >= v17.06.0.
-
Docker Toolbox for Windows. Docker version >=v17.06.0
-
Docker for Linux. Docker version >=v17.06.0
-
Ensuring the following ports are free on the host, as they are mounted by the containers:
80(Nginx)8000(Apache2)5601(Kibana)9200(Elasticsearch)3306(Mysql)
-
Atleast 4Gb of available RAM
-
wget - This is not a native tool on windows but readily available e.g. through chocolatey
-
If using a version of Docker for Windows that utilises a Virtualbox VM e.g. docker toolbox, ensure the Windows Loopback adapter is installed. This is not necessary if you are using Docker for Windows.
The example file uses docker-compose v2 syntax.
We assume prior knowledge of docker
All Elastic Stack components are version 5.5.1
The following illustrates the architecture deployed by the compose file. All components are deployed to a single machine.

Summarising the above, the following containers are deployed:
ElasticsearchKibanaFilebeat- Collecting logs from the apache2, nginx and mysql containers. Also responsible for indexing the host's system and docker logs.Packetbeat- Monitoring communication between all containers with respect to http, flows, dns and mysql.Heartbeat- Pinging all other containers over icmp. Additionally monitoring Elasticsearch, Kibana, Nginx and Apache over http. Monitors mysql over TCP.Metricbeat- Monitors nginx, apache2 and mysql containers using status check interfaces. Additionally, used to monitor the host system with respect cpu, disk, memory and network. Monitors the hosts docker statistics with respect to disk, cpu, health checks, memory and network.Nginx- Supporting container for Filebeat (access+error logs) and Metricbeat (server-status)Apache2- Supporting container for Filebeat (access+error logs) and Metricbeat (server-status)Mysql- Supporting container for Filebeat (slow+error logs), Metricbeat (status) and Packetbeat data.
In addition to the above containers, a configure_stack container is deployed at startup. This is responsible for:
- Setting the Elasticsearch passwords
- Importing any dashboards
- Ìnserting any custom templates and ingest pipelines
This container uses the Metricbeat images as it contains the required dashboards.
The following Beats modules are utilised in this stack example to provide data and dashboards:
-
Packetbeat, capturing traffic on all interfaces:
dns- port53http- ports9200,80,8080,8000,5000,8002,5601icmpflowsmysql- port3306
-
Metricbeat
apachemodule withstatusmetricsetdockermodule withcontainer,cpu,diskio,healthcheck,info,memoryandnetworkmetricsetsmysqlmodule withstatusmetricsetnginxmodule withstubstatusmetricsetsystemmodule withcore,cpu,load,diskio,filesystem,fsstat,memory,network,process,socket
-
Heartbeat
http- monitoring Elasticsearch (9200), Kibana (5601), Nginx (80), Apache(80)tcp- monitoring Mysql (3306)icmp- monitoring all containers
-
Filebeat
systemmodule withsyslogmetricsetmysqlmodule withaccessandslowlogmetricsetsnginxmodule withaccessanderrormetricsetsapachemodule withaccessanderrormetricsets
-
Download the
full_stack_example.tar.gz(OSX/Linux) orfull_stack_example.zipfile. This is provided as there is no easy way to download a sub folder of this repository. This represents the folders within this directory compressed.For linux/OSX:
wget https://raw.githubusercontent.com/elastic/examples/master/Miscellaneous/docker/full_stack_example/full_stack_example.tar.gz
For Windows (powershell):
wget https://github.com/gingerwizard/examples/raw/master/Miscellaneous/docker/full_stack_example/full_stack_example.zip -outfile "full_stack_example.zip" -
Extract the directory
For linux/OSX:
tar -xvf full_stack_example.tar.gz
-
The above command should result in a
full_stack_examplefolder. For OSX and Windows ensure that this folder is bind mounted and thus available to the docker containers. Further instructions on achieving this:Note: This step can be skipped if you extract the stack example into a subdirectory of
/Userson OSX or C:\Userson Windows.These directories are bind mounted by default. -
If using OSX or Windows, ensure the VM used to host docker is allocated a minimum of 4GB. Further instructions on achieving this:
-
For those using the older version of the Docker implementation for Windows i.e. Docker Toolbox, that utilises a Virtualbox VM, this currently does not support mapping ports to localhost. After installing the loopback adapter, map the following the ports for the docker VM using the network settings in the VirtualBox interface as shown below:
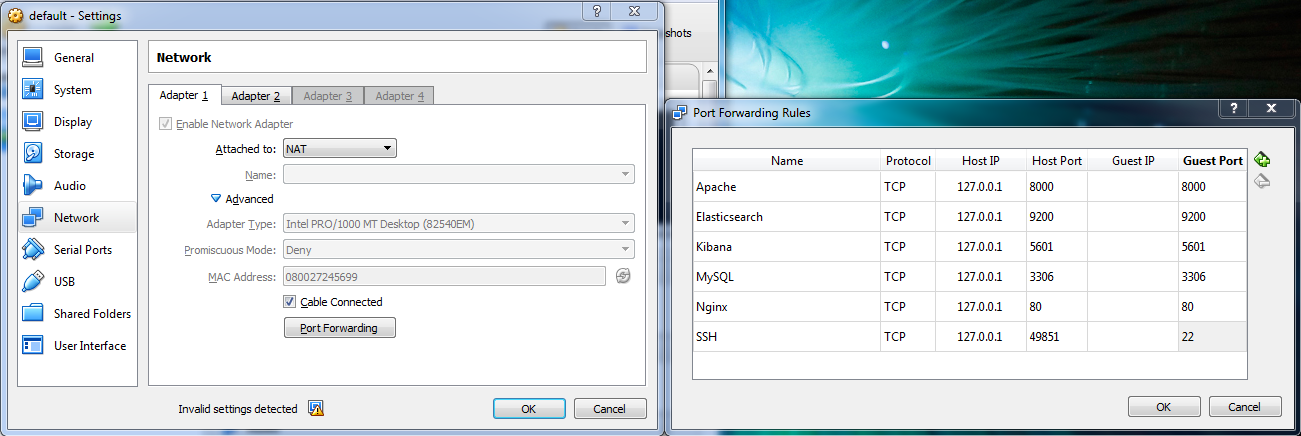
Further details here
-
Navigate into the full_stack_example folder from a terminal or powershell, and issue the following command. Adjust for your host operating system as shown.
cd full_stack_exampleFor osx
docker-compose -f docker-compose-osx.yml up
For windows
docker-compose -f docker-compose-windows.yml up
For linux
docker-compose -f docker-compose-linux.yml up
The above command may take some time if you don't have the base centos7 images
-
Confirm the containers are available, by issuing the following command:
docker ps -a
this will return a response such as the following:
CONTAINER ID        IMAGE                                                 COMMAND                  CREATED             STATUS                     PORTS                                          NAMES
618c9f2e7a5c        docker.elastic.co/beats/filebeat:5.5.1                "filebeat -e -E ou..."   4 minutes ago       Up 4 minutes                                                              filebeat
d35f1b864980        docker.elastic.co/beats/packetbeat:5.5.1              "packetbeat -e -E ..."   4 minutes ago       Up 4 minutes                                                              packetbeat
8a569ed62837        docker.elastic.co/beats/heartbeat:5.5.1               "heartbeat -e -E o..."   4 minutes ago       Up 4 minutes                                                              heartbeat
076e40495ef8        docker.elastic.co/beats/metricbeat:5.5.1              "metricbeat -e -E ..."   4 minutes ago       Up 4 minutes                                                              metricbeat
946a5034e37a        docker.elastic.co/beats/metricbeat:5.5.1              "/bin/bash -c 'cat..."   5 minutes ago       Exited (0) 4 minutes ago                                                  configure_stack
c6173ed51209        docker.elastic.co/kibana/kibana:5.5.1                 "/bin/sh -c /usr/l..."   5 minutes ago       Up 5 minutes (healthy)     127.0.0.1:5601->5601/tcp                       kibana
7ee2b178416e        fullstackexample_nginx                                "nginx -g 'daemon ..."   5 minutes ago       Up 5 minutes (healthy)     127.0.0.1:80->80/tcp, 443/tcp                  nginx
6ebdd87fccd8        fullstackexample_mysql                                "docker-entrypoint..."   5 minutes ago       Up 5 minutes (healthy)     127.0.0.1:3306->3306/tcp                       mqsql
198afa6b6325        docker.elastic.co/elasticsearch/elasticsearch:5.5.1   "/bin/bash bin/es-..."   5 minutes ago       Up 5 minutes (healthy)     127.0.0.1:9200->9200/tcp, 9300/tcp             elasticsearch
2c61e37a554b        fullstackexample_apache2                              "httpd-foreground"       5 minutes ago       Up 5 minutes (healthy)     127.0.0.1:8000->80/tcp                         apache2`
Whilst the container ids will be unique, other details should be similar. Note the
configure_stackcontainer will have exited on completion of the configuration of stack. This occurs before the beat containers start. Other containers should be "Up". -
On confirming the stack is started, navigate to kibana at http://localhost:5601 (OSX, Linux and Docker Toolbox for Windows) or http://docker.for.win.localhost:5601/ (Docker for Windows). Assuming you haven't changed the default password, see Customising the Stack, the default credentials of
elasticandchangemeshould apply. -
Navigate to the dashboard view. Open any of the dashboards listed as having data below. The following shows the Metricbeat-Docker dashboard.

The following dashboards are accessible and populated. Other dashboards, whilst loaded, will not have data due to the absence of an appropriate container e.g. Packetbeat Cassandra.
- CPU/Memory per container
- DNS
- Filebeat Apache2 Dashboard
- Filebeat MySQL Dashboard
- Filebeat Nginx Dashboard
- Filebeat syslog dashboard - Not available on Windows
- Heartbeat HTTP monitoring
- Metricbeat - Apache HTTPD server status
- Metricbeat Docker
- Metricbeat MySQL
- Metricbeat filesystem per Host
- Metricbeat system overview
- Metricbeat-cpu
- Metricbeat-filesystem
- Metricbeat-memory
- Metricbeat-network
- Metricbeat-overview
- Metricbeat-processes
- Packetbeat Dashboard (limited)
- Packetbeat Flows
- Packetbeat HTTP
- Packetbeat MySQL performance
The following summarises some important technical considerations:
- The Elasticsearch instances uses a named volume
esdatafor data persistence between restarts. It exposes HTTP port 9200 for communication with other containers. - Environment variable defaults can be found in the file .env`
- The Elasticsearch container has its memory limited to 2g. This can be adjusted using the environment parameter
ES_MEM_LIMIT. Elasticsearch has a heap size of 1g. This can be adjusted through the environment variableES_JVM_HEAPand should be set to 50% of theES_MEM_LIMIT. Users may wish to adjust this value on smaller machines. - The Elasticsearch password can be set via the environment variable
ES_PASSWORD. This sets the password for theelastic,logstash_systemandkibanauser. - The Kibana container exposes the port 5601.
- All configuration files can be found in the extracted folder
./config. - In order for the containers
nginx,apache2andmysqlto share their logs with the Filebeat container, they mount the folder./logsrelative to the extracted directory. Filebeat additionally mounts this directory to read the logs. - The Filebeat container mounts the host directories
/private/var/log(osx) and/var/log(linux) in order to read the host's system logs. This feature is not available in Windows - The Filebeat container mounts the host directory
/var/lib/docker/containersin order to access the container logs. These are ingested using a custom prospector and processed by an ingest pipeline loaded by the containerconfigure_stack. - The Filebeat registry file is persisted to the named volume
fbdata, thus avoiding data duplication during restarts - In order to collect docker statistics, Metricbeat mounts the hosts
/var/run/docker.sockdirectory. For windows and osx, this directory exists on the VM hosting docker. - Packetbeat is configured to use the hosts network, in order to capture traffic on the host system rather than that between the containers. However, for Windows and OSX based systems this "host system" represents the linux VM, hosting docker, running on Hyper-V (windows) or HyperKit(OSX). The native interface on the actual host system is currently not visible to Packetbeat for these operating systems. The user will therefore only see traffic between the containers and host VM. Improvements and contributions welcome in this area.
- For data persistence between restarts the
mysqlcontainer uses a named volumemysqldata. - The nginx, msql and apache containers expose ports 80, 8000 and 3306 respectively on the host. Ensure these ports are free prior to starting
- The Metricbeat container mounts both
/procand/sys/fs/cgroupon linux. This allows Metricbeat to use thesystemmodule report on disk, memory, network and cpu of the host. This is only performed on linux. For windows and osx the stats of the VM hosting docker will be reported. The module detects virtual disks will be result in confusing statistics. This is pending improvement - In for Filebeat to index the docker logs it mounts
/var/lib/docker/containers. These JSON logs are ingested into the indexdocker-logs-<yyyy-MM-dd> - On systems with POSIX file permissions, all Beats configuration files are subject to ownership and file permission checks. The purpose of these checks is to prevent unauthorized users from providing or modifying configurations that are run by the Beat. The owner of the configuration file must be either root or the user who is executing the Beat process. The permissions on the file must disallow writes by anyone other than the owner. As we mount our configurations from the host, where the user is likely different than that used to run the container and the beat process, we disable this check for all beats with -strict.perms=false.
The majority of the dashboards will simply populate due to inherent “noise” caused by the images. However, we do expose a few additional ports for interaction to allow unique generation. These include:
- MySQL - port 3306 is exposed allowing the user to connect. Any subsequent Mysql traffic will in turn be visible in the dashboards “Filebeat MySQL Dashboard”, “Metricbeat MySQL” and “Packetbeat MySQL performance”.
- Nginx - port 80. Currently we don’t host any content in Nginx so requests will result in 404s. However, content can easily be added as described here.
- Apache2 - port 8000. Other than the default Apache2 “It works” pages the stack doesn’t host any content. Again easily changed.
- Docker Logs - Any activity to the docker containers, including requests to Kibana, are logged. These logs are captured in JSON form and indexed into a index “docker-logs-<yyyy.mm.dd>”.
With respect to the current example, we have provided a few simple entry points for customisation:
- The example includes an .env file listing environment variables which alter the behaviour of the stack. These environment variables allow the user to change:
ELASTIC_VERSION- the Elastic Stack version (default 5.5.1)ES_PASSWORD- the password used for authentication with the elastic user. This password is applied for all system users i.e. kibana and logstash_system. Defaults to “changeme”.MYSQL_ROOT_PASSWORD- the password used for the root mysql user. Defaults to “changeme”.DEFAULT_INDEX_PATTERN- The index pattern used as the default in Kibana. Defaults to “metricbeat-*”.ES_MEM_LIMIT- The memory limit used for the Elasticsearch container. Defaults to 2g. Consider reducing for smaller machines.ES_JVM_HEAP- The Elasticsearch JVM heap size. Defaults to 1024m and should be set to half of the ES_MEM_LIMIT.
- Modules and Configuration - All configuration to the containers is provided through a mounted “./config” directory. Where possible, this exploits the dynamic configuration loading capabilities of Beats. For example, an additional module could be added by simply adding a file to the directory “./config/beats/metricbeat/modules.d/” in the required format.
- Pipelines and templates - we provide the ability to add custom ingest pipelines and templates to Elasticsearch when the stack is first deployed. More specifically: `
- Ingest templates should be added under
./init/templates/. These will be added on startup of the stack, with an id equal to the filename. For example,docker-logs.jsonwill be added as a template with iddocker-logs. - Pipelines should be added under
./init/pipelines/. These will be added on startup of the stack, with an id equal to the filename. For example,docker-logs.jsonwill be added as a pipeline with iddocker-logs.
- Ingest templates should be added under
Ctrl-C will exit the containers and ensure they are shut down gracefully. To remove all containers, including their mounted named volumes:
docker-compose -f docker-compose-<os>.yml down -v

e.g.

docker-compose -f docker-compose-linux.yml down -vIf you found this example helpful and would like to see more such Getting Started examples for other standard formats, we would love to hear from you. If you would like to contribute examples to this repo, we'd love that too!