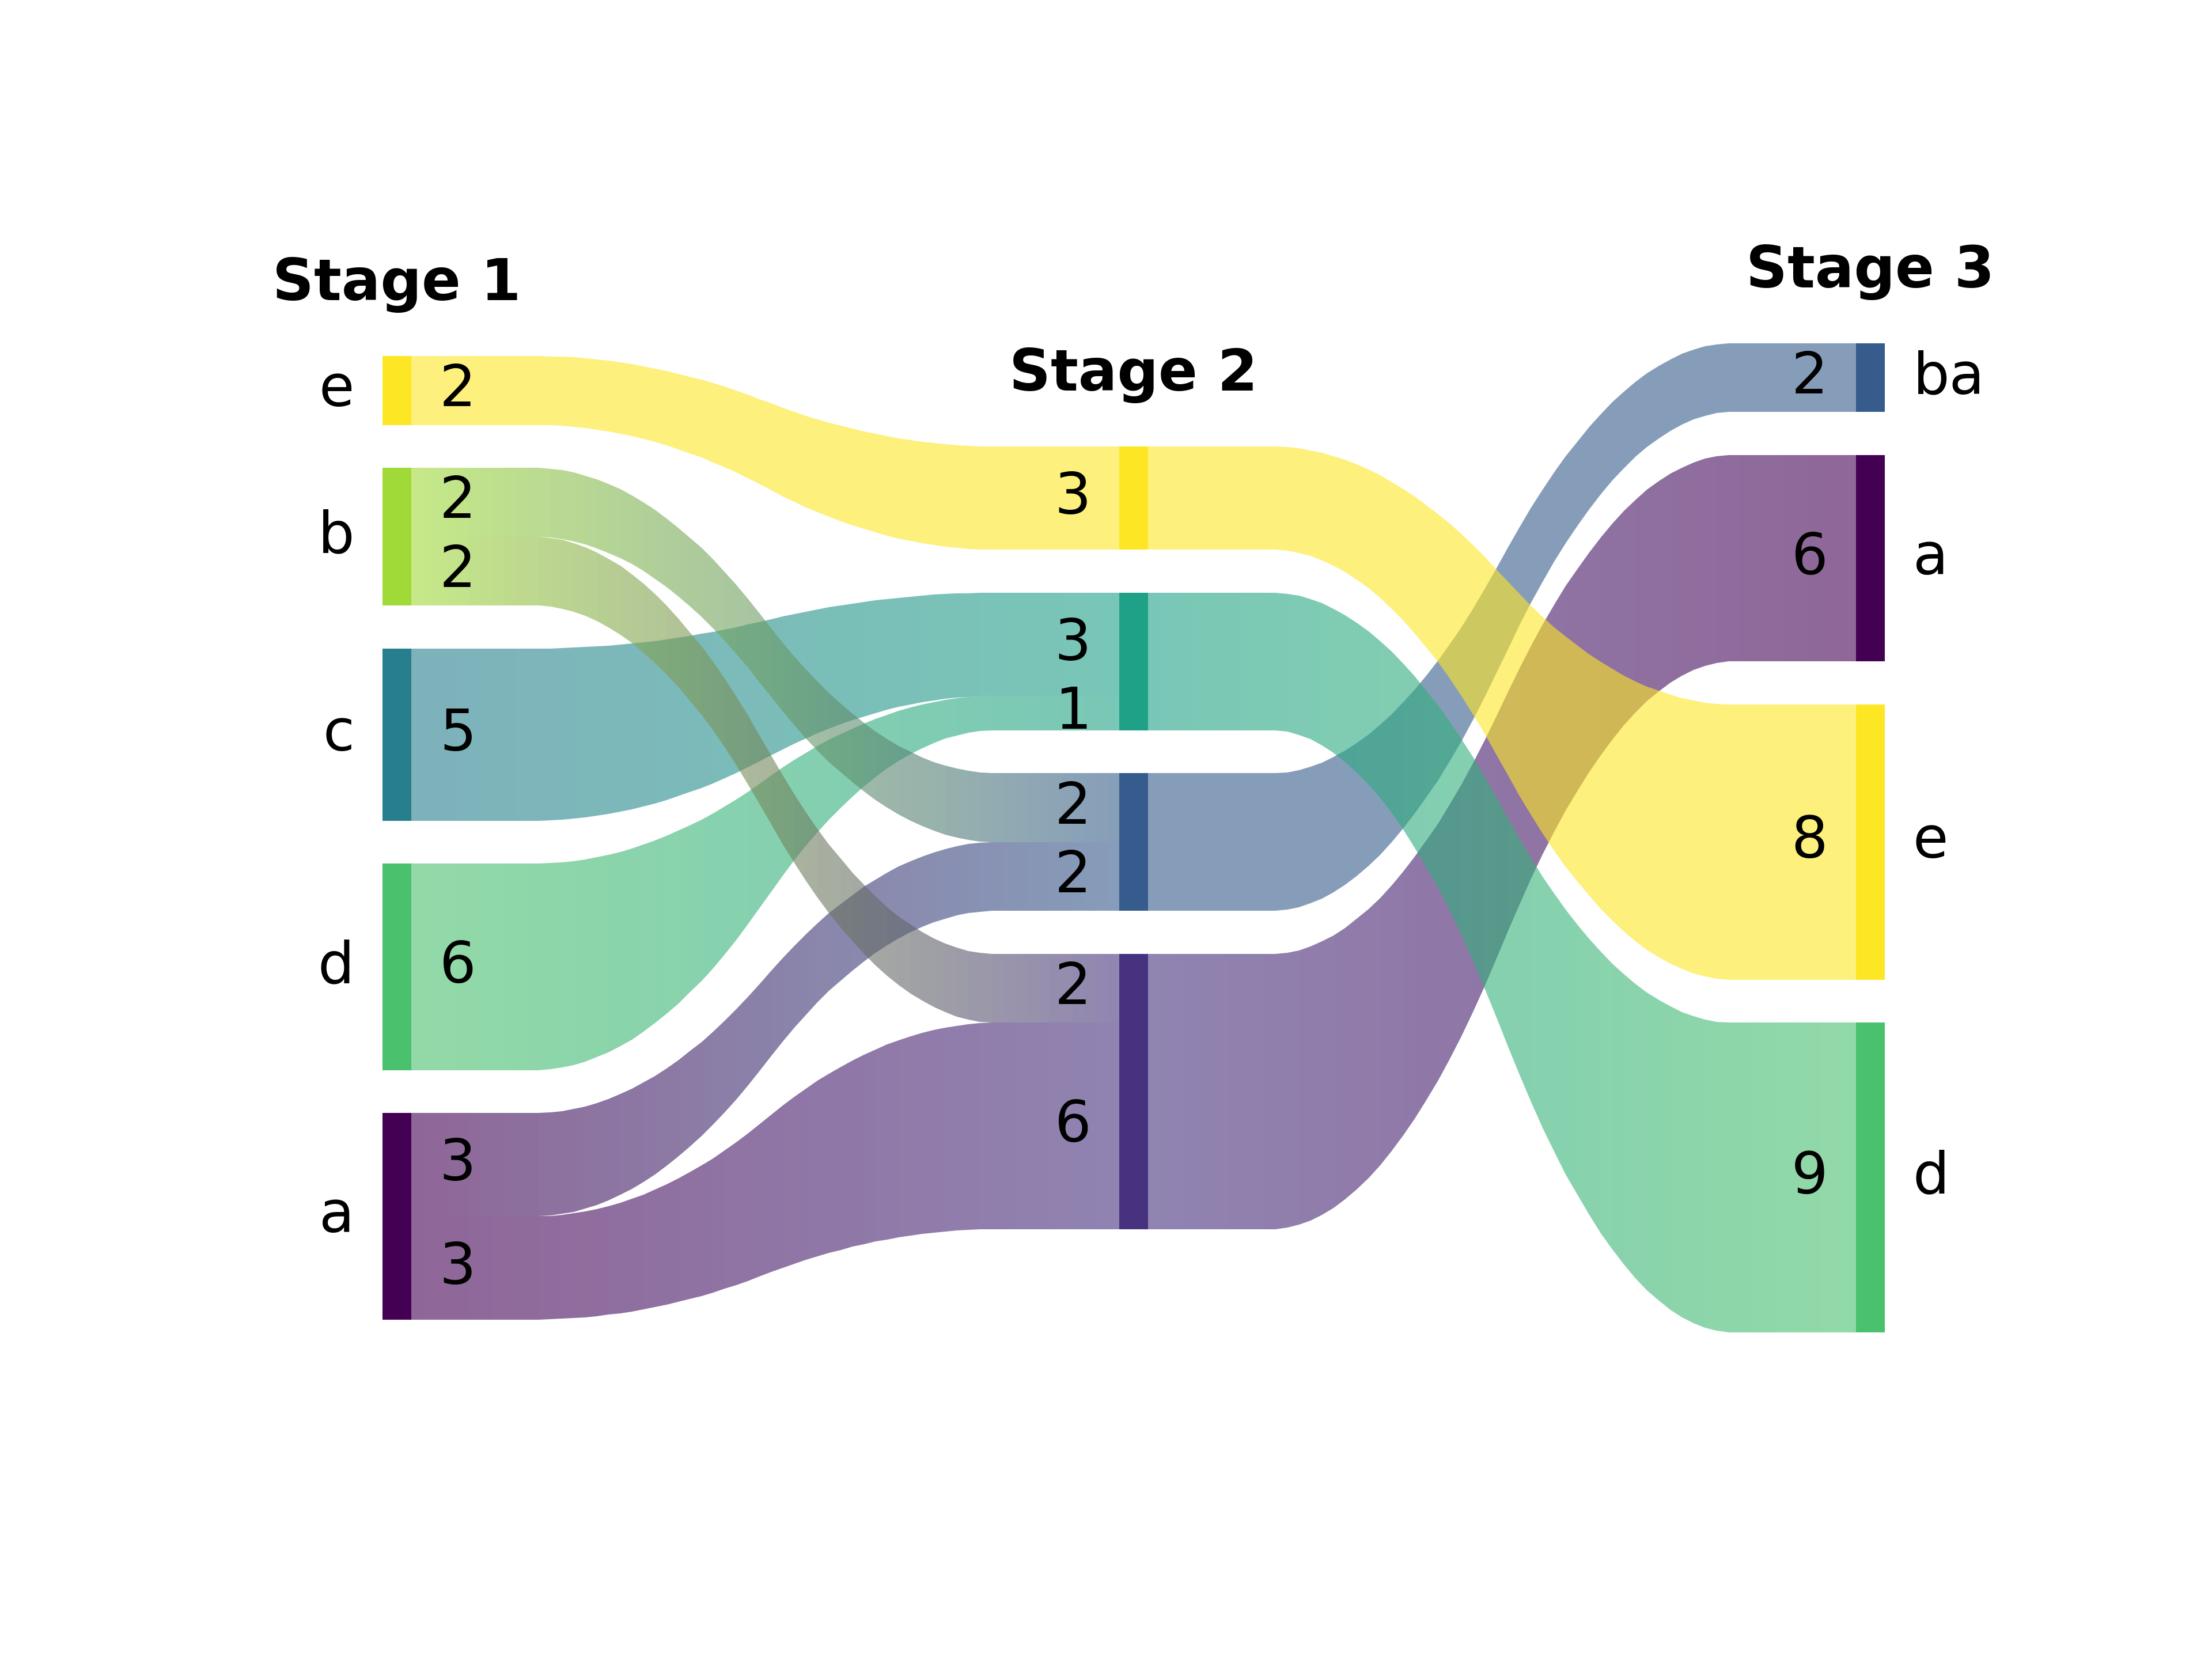
Uses matplotlib to create simple Sankey diagrams flowing only from left to right.
![]()
![]()
![]()
This package is available on PyPi and can be installed via:
pip install ausankey
User documentation for the repository is published via GitHub Pages: https://avc-adelaide.github.io/ausankey/
Code documentation by Mkdocs is available here: https://avc-adelaide.github.io/ausankey/reference/
import ausankey as sky
import matplotlib.pyplot as plt
import pandas as pd

data = pd.DataFrame([
  ("a",1.0,"ab",2.0,"a",1.0),
  ("a",1.0,"ba",0.8,"ba",0.4),
  ("c",1.5,"cd",0.5,"d",2.0),
  ("b",0.5,"ba",0.8,"ba",0.4),
  ("b",0.5,"ab",0.8,"a",1.0),
  ("d",2.0,"cd",0.4,"d",1.0),
  ("e",1.0,"e",1.0,"e",3.0),
])

plt.figure()
sky.sankey(
  data,
  sort      = "top",
  titles    = ["Stage 1","Stage 2","Stage 3"],
  valign    = "center",
)
plt.show()
If you are a uv user, this will get you started:
cd ausankey-example && mkdir ausankey-example
uv init --bare
uv add ausankey
uv run ausankey-example.py
(with ausankey-example.py given above.)
- Python 3.x
- matplotlib
- numpy
- pandas