Python package for fitting logistic functions to data
Have you ever wanted to fit a flexible logistic function to your data??? If so, this might be useful...
This tool fits a logistic function to a series of data points AND provides information about the goodness of your model fit (based on permutation testing). The logistic function takes the form:
 (image from https://andymath.com/logistic-function/)
from log_fit import main_log_fit
results = main_log_fit(x, y) # Runs without any permutation testing - fast (by default)
results = main_log_fit(x, y, to_perm_test=True, Nsim=1000) # Run with permutation testing to determine whether fit is significant, N=1000 null simulations
Parameters:
results.x inflection point (value of x where maximum change in y occurs; x0 in function above)
results.k slope (k in above formula, 'growth rate')
results.y_init y-value at x=0
results.y_final y-value at asymptote (L in above formula)
results.y_change total change in y (y_final minus y_init)
Goodness of fit information:
results.stats_r Spearman Rank correlation between actual y and predicted y values (goodness of fit metric)
results.stats_Ppara P-value from Rank correlation between actual y and predicted y values (i.e. parametric)
results.stats_Pperm P-value of goodness of fit based on permutation testing
See the Jupyter notebook in this repo for examples. Some snippets are below!
First, imports. The function main_log_fit is imported from log_fit.py

Next, some data to work with:
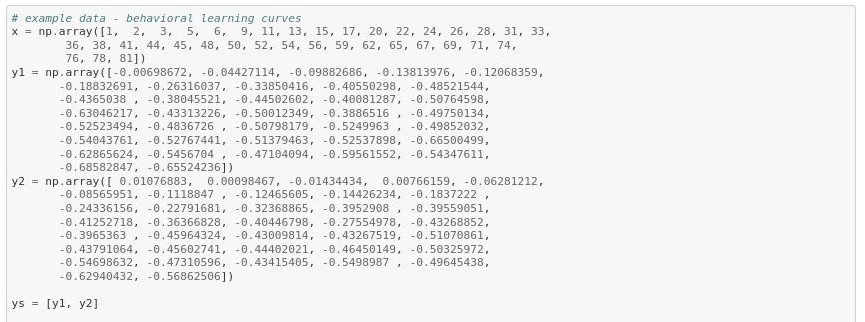
Here is what it looks like (note, this is real data from a behavioral learning experiment!):

Now, use model_log_fit to actually fit functions to the data (y1, y2):
As shown in the first two lines above, the function can be run by just fitting a model to the data (without performing any permutation testing). By default, no permutation testing is performed.
OR (last two lines), it can be run with permutation testing, which assesses the statistical significance of a model fit occuring by chance. Specifically, a null distribution of the model fit is generated by randomly permuting the values in X and computing the model fit based on permuted-X and Y values. The true model fit is then compared to the null distribution of models fit to produce a P-value (probability that a model fit of similar or higher value is observed by chance).
Here are the resulting model fits:

And the actual numbers that are of interest...
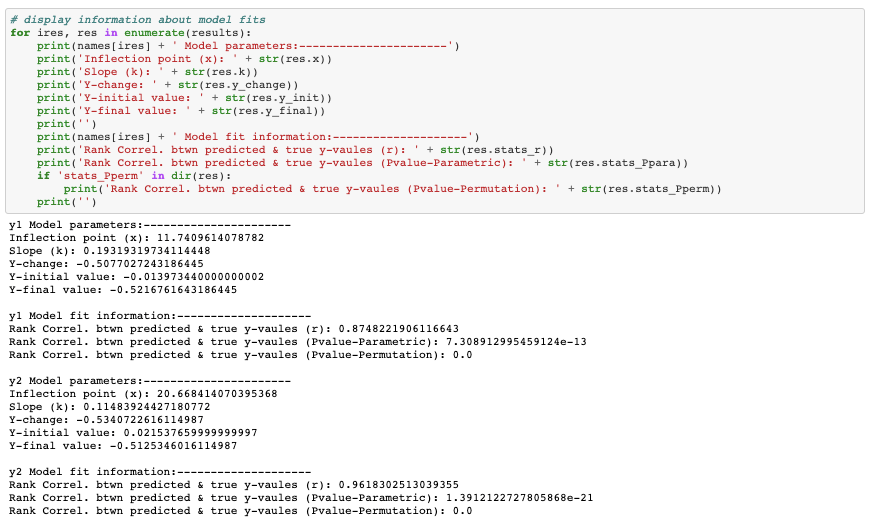
All outputs of interest are in the results object, which are described above