 |
 |
Assigned task
Using the SciChart library, create an application in Kotlin.
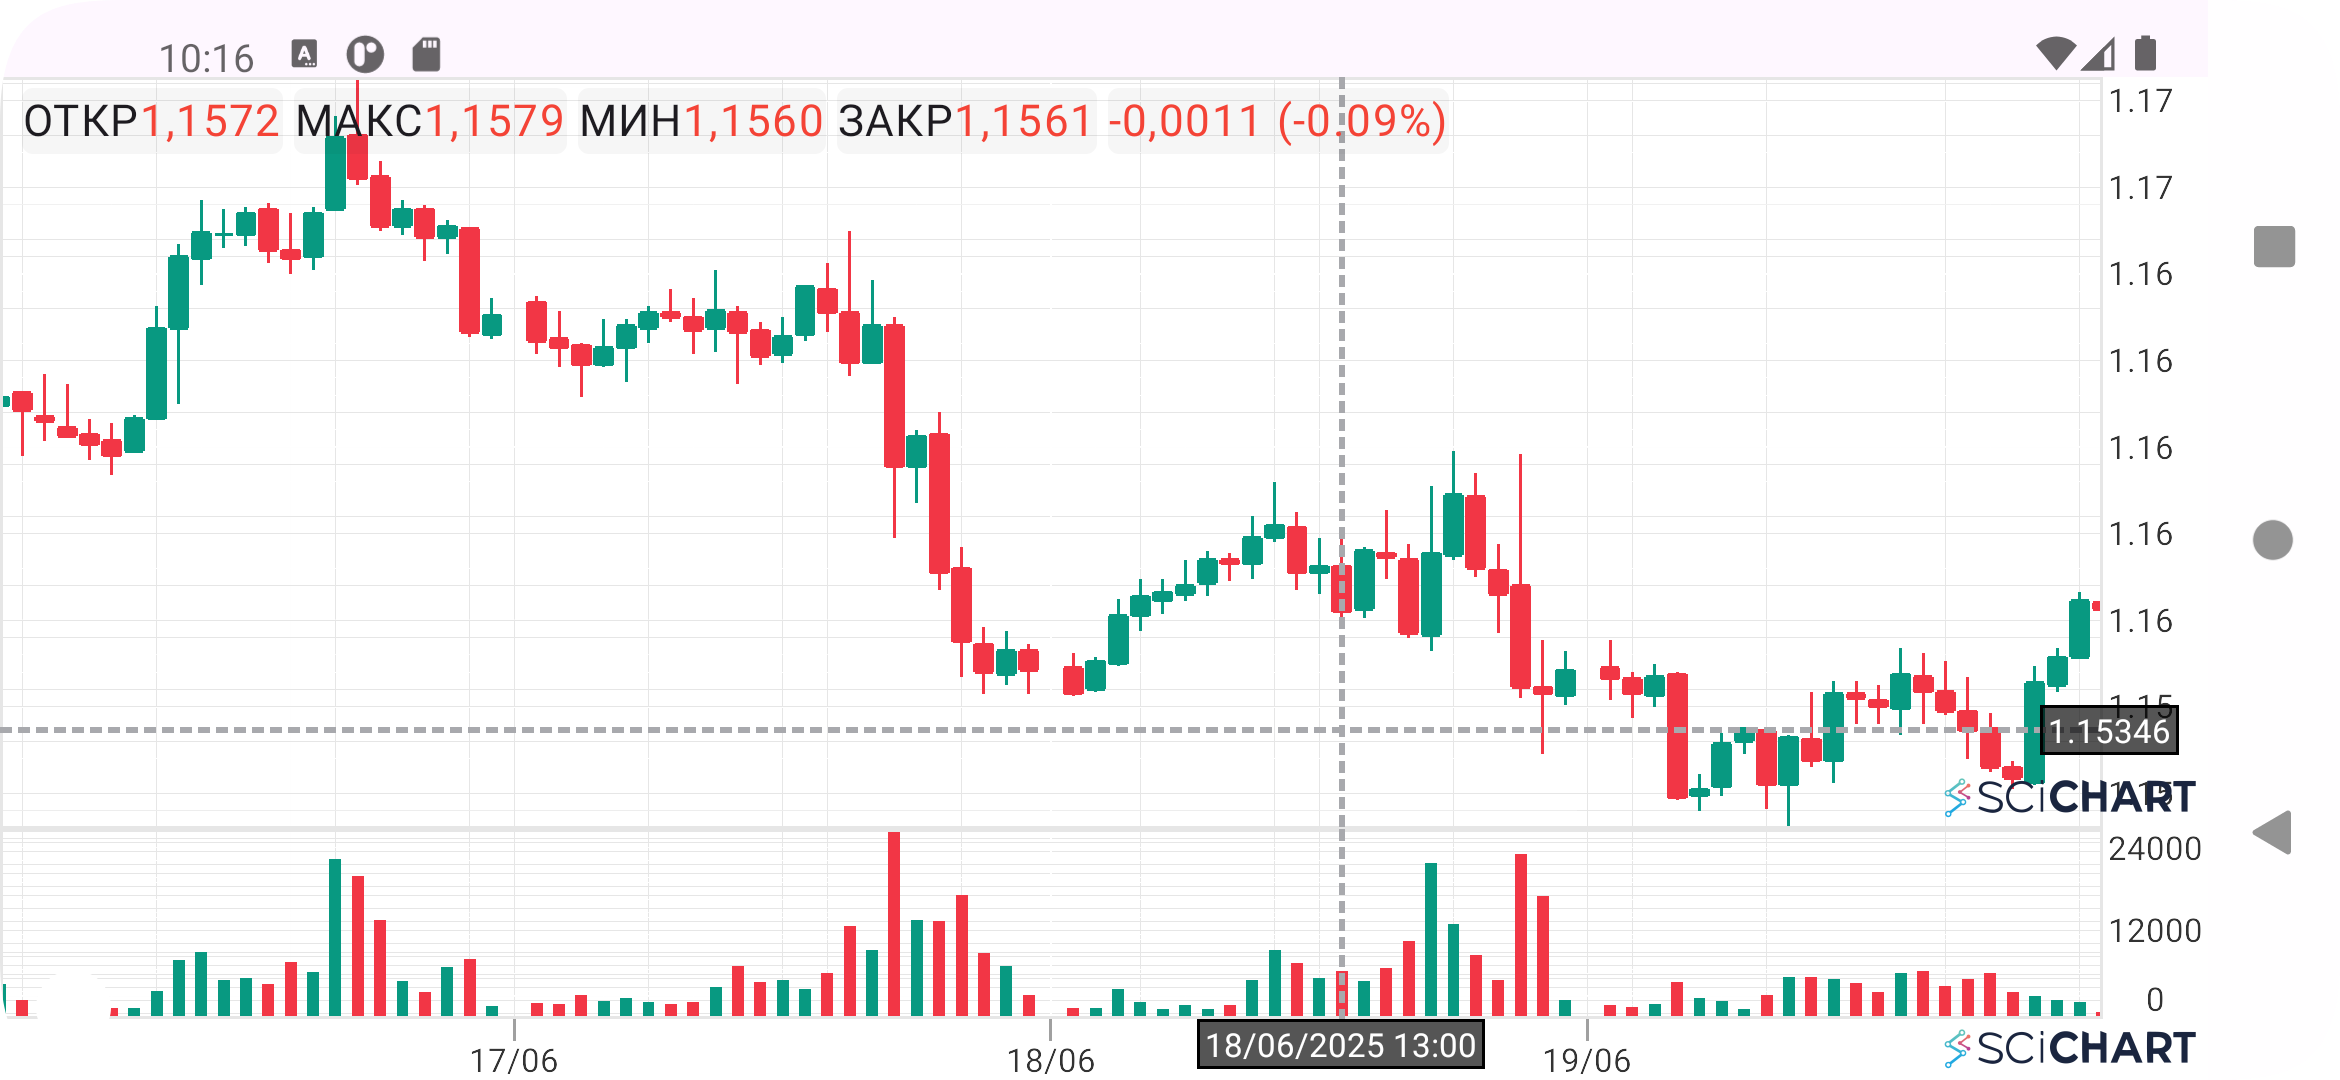
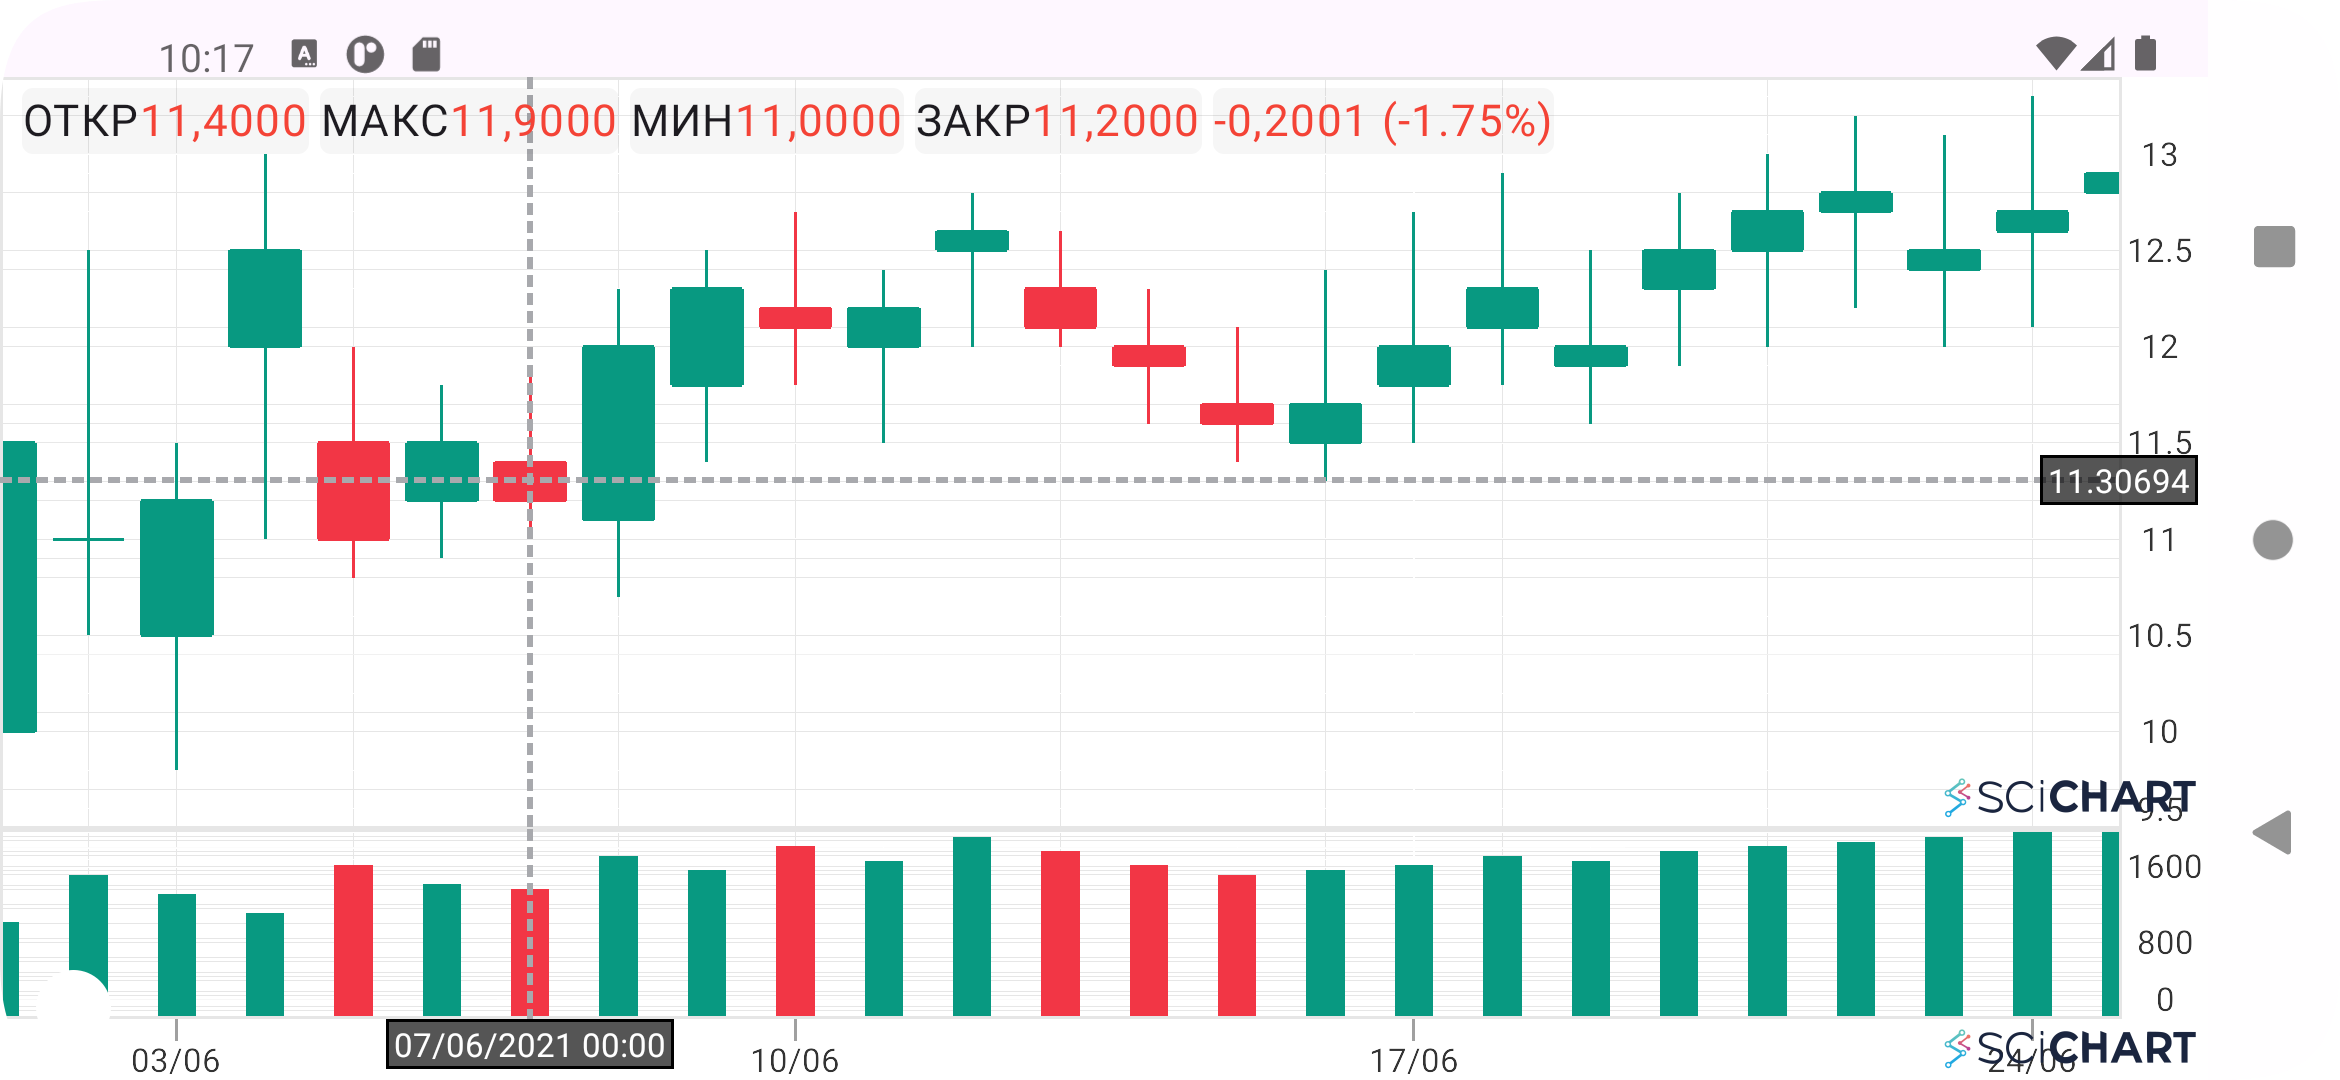
- The application should consist of a candlestick stock chart (OHLCV) with a volume histogram placed in an additional (bottom) pane.
- Place the time axis on the volume histogram.
- Add a crosshair cursor. The cursor should be activated by holding a finger on the chart. Movement along the time axis should snap strictly to the center of the candlesticks, similar to the cursor behavior in TradingView.
Additionally:
- Obtain a SciChart demo license independently.
- For building the chart, use EURUSD 1h data for the period from 16.06.25 to 18.06.16 inclusive (see file).
- Please ensure the functionality, control methodology, and design are similar to cTrader or TradingView.