Skip to content

Conversation

@franz1981
Copy link
Contributor

That's an alternative of #9 that focus on closing the gap with the original implementation in C and that's just 1:1 with the original version in term of internal behaviour

@franz1981
Copy link
Contributor Author

franz1981 commented Oct 20, 2020

This the results from running a bench with 2000 clients (1000 producers 1000 consumers 1000 queues) on a Intel(R) Xeon(R) CPU E5-2650 v4 @ 2.20GHz :

NEW:

**************
RUN 1   EndToEnd Throughput: 55361 ops/sec
**************
EndToEnd SERVICE-TIME Latencies distribution in MICROSECONDS
mean              18024.22
min                 598.02
50.00%            18087.94
90.00%            20840.45
99.00%            24510.46
99.90%            40894.46
99.99%            69206.02
max               72876.03
count              1000000

OLD:

**************
RUN 1   EndToEnd Throughput: 54203 ops/sec
**************
EndToEnd SERVICE-TIME Latencies distribution in MICROSECONDS
mean              18411.60
min                 376.83
50.00%            18481.15
90.00%            21102.59
99.00%            26214.40
99.90%            44040.19
99.99%            72351.74
max               76021.76
count              1000000

Troughput seems a bit increased and latency are a bit lower, I'm going to try with different number of clients to check if it's still true

@franz1981
Copy link
Contributor Author

I've tested with 2-20 and 200 clients getting the same: this branch seems on par with master in C: let's see with a faster disk...

@michaelandrepearce
Copy link

michaelandrepearce commented Oct 23, 2020

To note, I've been testing this branch against master using an independent test rig with large real servers we use. And it corroborate the above stats, we are seeing in most parts no perf difference. As raised privately to Franz but putting it here for public. Synthetic performance != real use cases. I would suggest whilst we switch ASYNCIO over to this newer implementation, we should add another configuration ASYNCIO_LEGACY for a few releases so if anyone does see a perf drop in real usecases they can switch back to the legacy jni one quickly. And report the issue

@franz1981
Copy link
Contributor Author

I would suggest whilst we switch ASYNCIO over to this newer implementation, we should add another configuration ASYNCIO_LEGACY for a few releases so if anyone does see a perf drop in real usecases they can switch back to the legacy jni one quickly. And report the issue

This is a great suggestion indeed, taken!
Next week I'll think what could be the best approach to guarantee that for users that would see perf drops 👍

@franz1981
Copy link
Contributor Author

franz1981 commented Oct 23, 2020

@michaelandrepearce
Just FYI I've collected some profiling data to understand other bottlenecks while dealing with massive amount of clients and fairly fast disks and I see:

image

Differently from my expectation isn't the fdatasync that's backpressuring the incoming I/O requests, because a very fast disk can be quite fast to sync data on disks, but ThreadPoolExecutor::execute (in violet, below) due to the slow offer on LBQ:

image

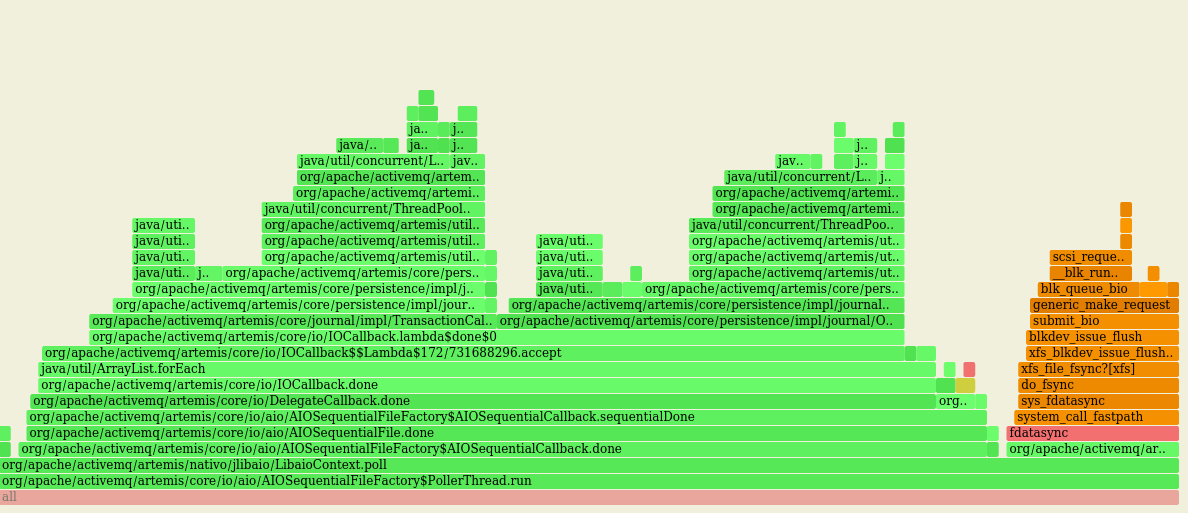
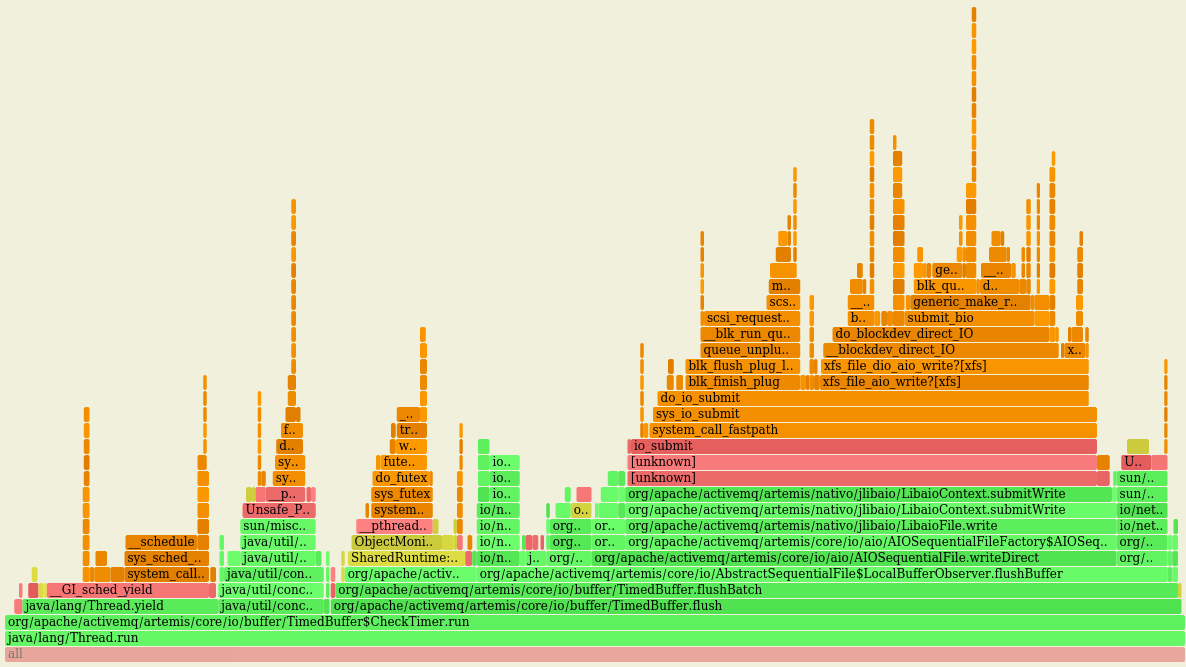
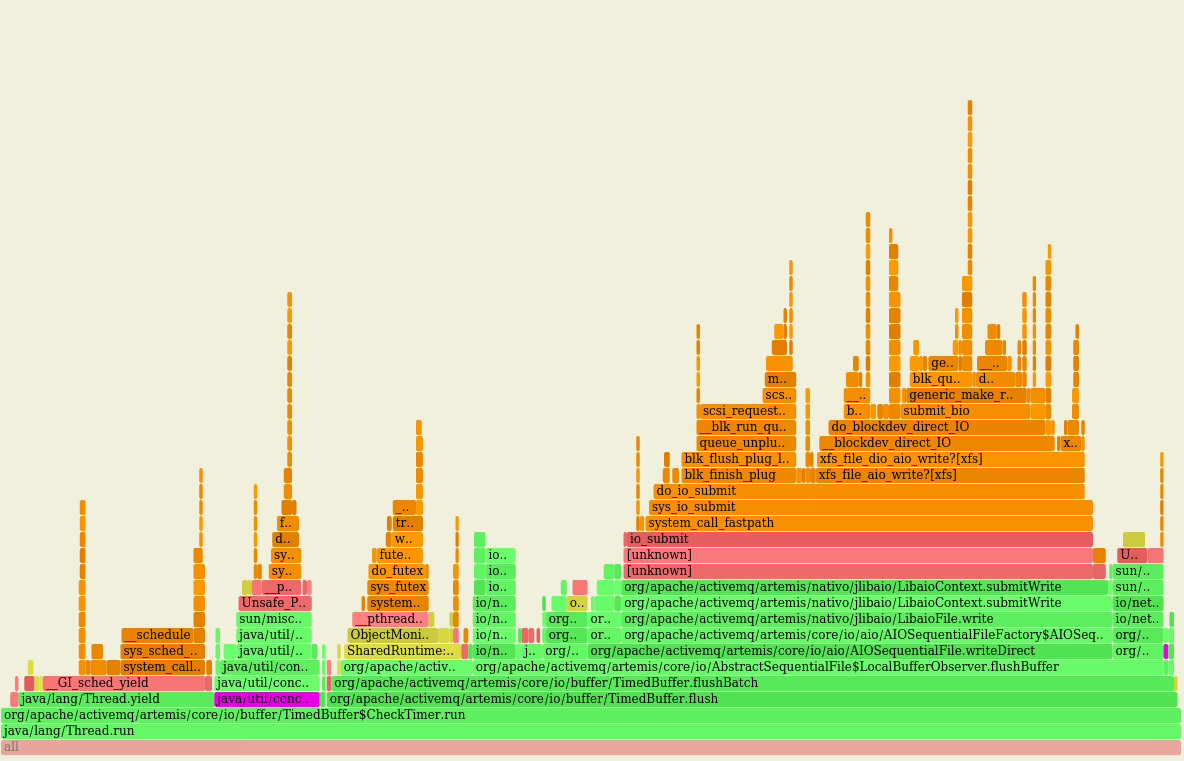
This could be improved by using a better Thread pool queue (see https://issues.apache.org/jira/browse/ARTEMIS-2240), but the risk is that the a faster AIOSequentialCallback::done won't backpressure enough incoming requests and the fdatasync batches became smaller, exausting the avaialble IOPS. This need some tests to be sure that worth it.

Another interesting point to observe is the TimedBuffer$CheckTimer::run :
image

There are few things that doesn't look right to me:

  • Thread::yield
    image

  • Semaphore::acquire
    image

  • intrinsic lock monitor exit after flushed
    image

The latter 2 ones are competing over OS resources for the sole purpose of wake up someone (ie who call TimedBuffer:.addBytes very likely), while the first one seems just strange to me and need investigation.

@franz1981
Copy link
Contributor Author

franz1981 commented Oct 23, 2020

@michaelandrepearce
I've tried to revert https://issues.apache.org/jira/browse/ARTEMIS-2240 on master while using the Java version (this PR) of libaio and I'm getting mixed feelings...
The original poll loop was taking 185 samples ie 18,5% of 1 core, while the new version takes 594 samples ie 59,4% of 1 core, with this shape

image

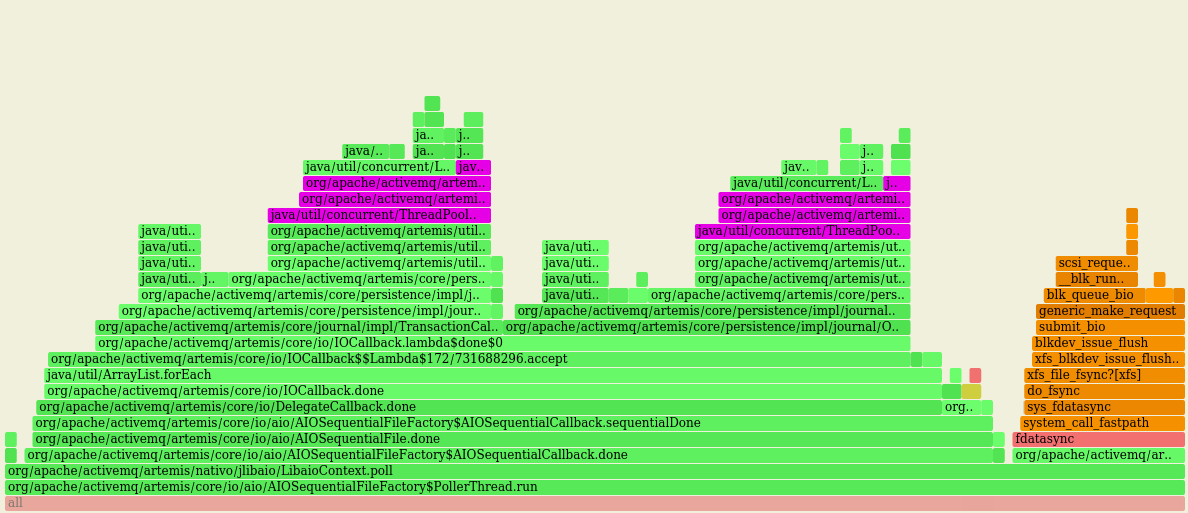
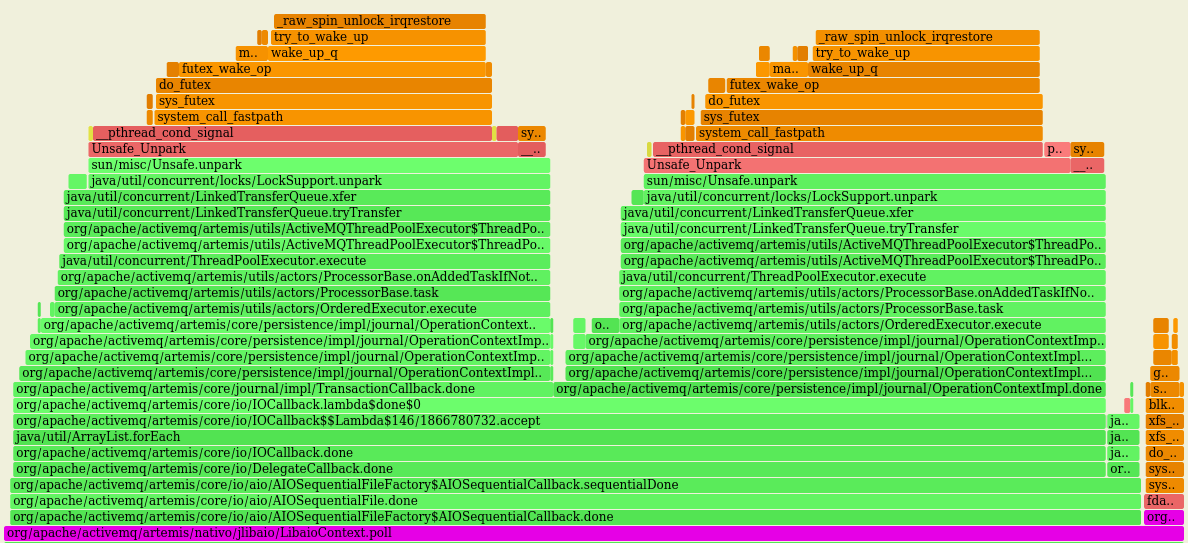
That seems to me that most of the time of this loop is spent by submitting tasks to awake threads of the pool, something that doesn't feel right to me...

Although this I'm getting overall better performance, the impact, CPU-wise, of using such queue is high (LTQ in violet):
image

vs the original behaviour with LBQ (in violet as well):
image

On a fresh run of this PR on the same machine I got:

**************
RUN 1	EndToEnd Throughput: 56564 ops/sec
**************
EndToEnd SERVICE-TIME Latencies distribution in MICROSECONDS
mean              17662.11
min                 468.99
50.00%            17694.72
90.00%            20185.09
99.00%            29622.27
99.90%            37486.59
99.99%            49545.22
max               58458.11
count              2000000

While, after switching to LTQ:

**************
RUN 1	EndToEnd Throughput: 57022 ops/sec
**************
EndToEnd SERVICE-TIME Latencies distribution in MICROSECONDS
mean              17514.22
min                 333.82
50.00%            18874.37
90.00%            22151.17
99.00%            29491.20
99.90%            33816.58
99.99%            39321.60
max               46137.34
count              2000000

Troughput is marginally increased (< 1%) while the CPU usage has increased a lot ie +~25%

@clebertsuconic
Copy link
Contributor

this is replaced by #14

Sign up for free to join this conversation on GitHub. Already have an account? Sign in to comment

Labels

None yet

Projects

None yet

Development

Successfully merging this pull request may close these issues.

3 participants